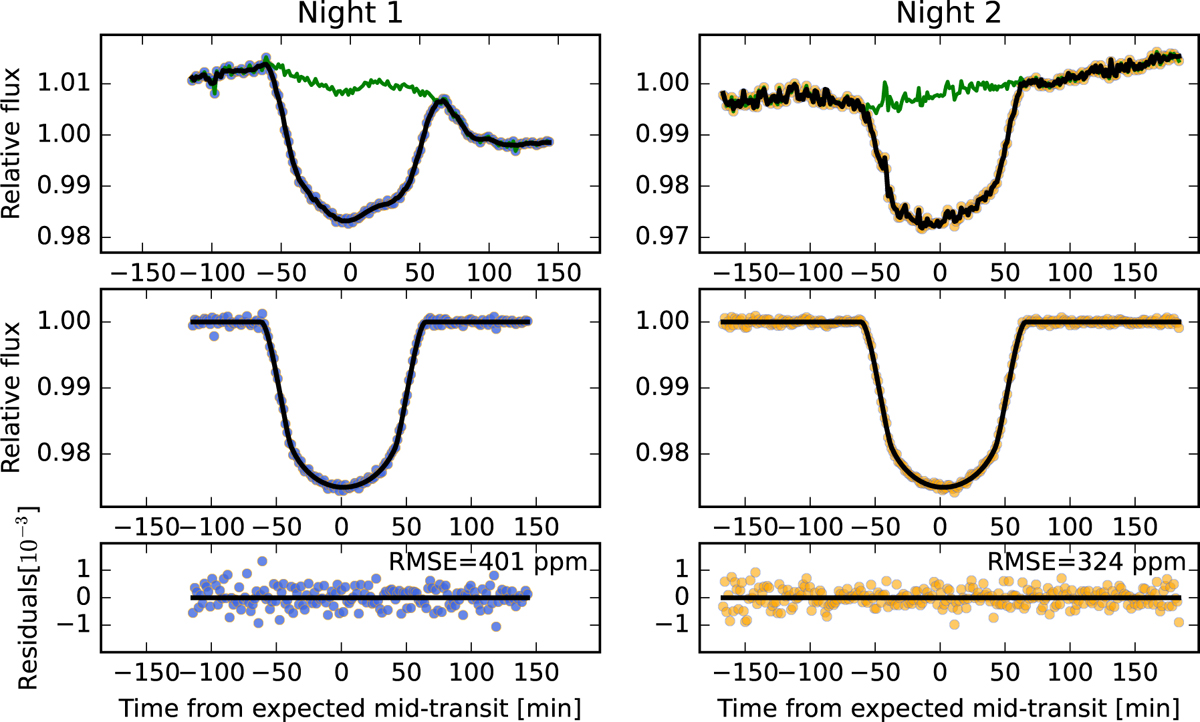
Fig. 2
Download original image
White light curves of NGTS-5 observed with GTC/OSIRIS on Night 1 (left) and Night 2 (right). Top panels: Observed white light curves (blue circles for Night 1, orange circles for Night 2), best-fit models (black lines), and modeled systematics (green lines). Middle panels: De-trended white light curves with the best-fit transit models. Bottom panels: Residuals between the observed data and best-fit models.
Current usage metrics show cumulative count of Article Views (full-text article views including HTML views, PDF and ePub downloads, according to the available data) and Abstracts Views on Vision4Press platform.
Data correspond to usage on the plateform after 2015. The current usage metrics is available 48-96 hours after online publication and is updated daily on week days.
Initial download of the metrics may take a while.