Open Access
Fig. 3
Download original image
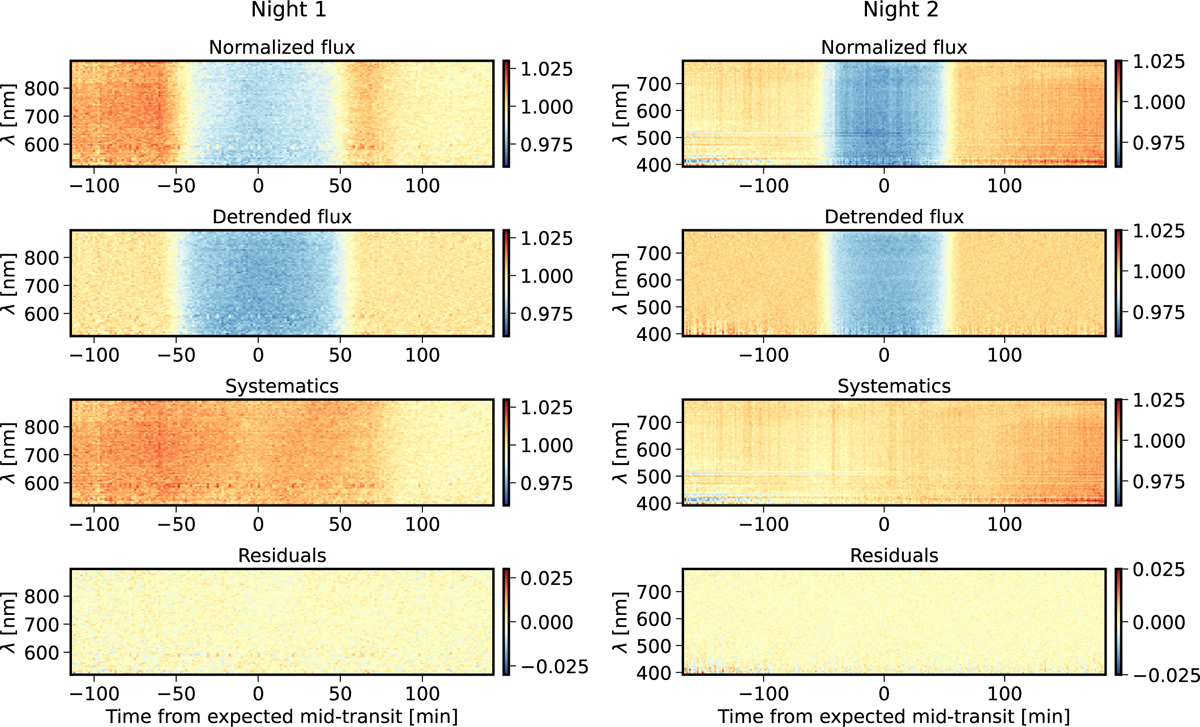
Spectroscopic light curves of NGTS-5 observed with GTC/OSIRIS on Night 1 (left) and Night 2 (right). First row: matrix of the raw light curves. Second row: matrix of the de-trended light curves. Third row: Matrix of the extracted systematics. Fourth row: matrix of the residuals.
Current usage metrics show cumulative count of Article Views (full-text article views including HTML views, PDF and ePub downloads, according to the available data) and Abstracts Views on Vision4Press platform.
Data correspond to usage on the plateform after 2015. The current usage metrics is available 48-96 hours after online publication and is updated daily on week days.
Initial download of the metrics may take a while.