| Issue |
A&A
Volume 707, March 2026
|
|
|---|---|---|
| Article Number | A345 | |
| Number of page(s) | 12 | |
| Section | Catalogs and data | |
| DOI | https://doi.org/10.1051/0004-6361/202558049 | |
| Published online | 23 March 2026 | |
Gaia GraL: The GraL catalogue of gravitationally lensed quasars
X. Matched with Gaia data, redshifts, and time delays
1
Laboratoire d’Astrophysique de Bordeaux, Univ. Bordeaux, CNRS, B18N,
allée Geoffroy Saint-Hilaire,
33615
Pessac,
France
2
Instituto de Astronomia, Geofísica e Ciências Atmosféricas, Universidade de São Paulo, Rua do Matão, 1226, Cidade Universitária,
05508-900
São Paulo, SP,
Brazil
3
Donald Bren School of Information and Computer Sciences, University of California,
Irvine,
CA
92697,
USA
4
CENTRA/SIM, Faculdade de Ciéncias, Universidade de Lisboa,
Ed. C8, Campo Grande,
1749-016,
Lisboa,
Portugal
5
Université Côte d’Azur, Observatoire de la Côte d’Azur, CNRS, Laboratoire Lagrange,
Bd de l’Observatoire,
CS 34229,
06304
Nice cedex 4,
France
6
Sydney Institute for Astronomy, School of Physics, The University of Sydney,
NSW
2006,
Australia
7
Center for Astrophysics Harvard & Smithsonian,
60 Garden St.,
02138
Cambridge,
MA,
USA
8
Space sciences, Technologies and Astrophysics Research (STAR) Institute, University of Liège,
Belgium
9
Centre for Astrophysics and Supercomputing, Swinburne University of Technology,
Hawthorn, Victoria,
Australia
10
Center for Theoretical Physics, Polish Academy of Sciences,
Warsaw,
Poland
11
Lohrmann-Observatorium, Technische Universitaet Dresden,
01062
Dresden,
Germany
12
Aryabhatta Research Institute of Observational Sciences (ARIES),
Manora Peak,
Nainital
263002,
India
13
Departamento de Física CCET, Universidade Federal de Sergipe,
Rod. Marechal Rondon s/n, 49.100-000 Jardim Rosa Elze,
São Cristóvão, SE,
Brazil
14
Centre for Astrophysics Research, University of Hertfordshire,
College Lane,
Hatfield,
AL10 9AB,
UK
15
Astronomisches Rechen-Institut (ARI), Zentrum fur Astronomie der Universitaet Heidelberg (ZAH),
Moenchhofstr. 12–14,
69120
Heidelberg,
Germany
16
INAF – Osservatorio Astronomico di Roma,
Via Frascati 33,
00078
Monte Porzio Catone,
Italy
17
Kavli Institute for Astronomy and Astrophysics, Peking University,
Beijing
100871,
China
★ Corresponding author: This email address is being protected from spambots. You need JavaScript enabled to view it.
Received:
10
November
2025
Accepted:
18
February
2026
Abstract
Determining the Hubble constant tension requires alternative strategies, and multiply imaged quasars, with their intermediate redshifts, can potentially be used in this regard. We provide a currently complete catalogue of spectroscopically confirmed lensed quasars with ESA/Gaia astrometry and photometry, as well as redshifts and time delays when available. In addition to the improved astrometry, the catalogue increases the number of lensed quasars by a factor of 1.5 (now 364, of which 277 are doubles and 87 are quads or triples) and significantly increases the number of lensing galaxies detected (now 218), which represents a major step forward. Redshifts are provided for 347 quasars and 188 deflectors. A completely new table of time delays, required for estimates of H0, is presented, with 195 time delays from 73 systems. Gaia absolute astrometry is sub-milliarcsecond and covers the entire sky. Future Gaia data releases will provide long-term photometry, which should provide many more time delays. The catalogues as presented here enable machine-learning techniques to be trained and tested and subsequently applied to the Gaia data releases. Finally, we derive simple but homogeneous models of the 18 quadruply imaged quasars for which images of all four components are presented in Gaia DR3.
Key words: catalogs / astrometry / galaxies: active / quasars: emission lines
© The Authors 2026
 Open Access article, published by EDP Sciences, under the terms of the Creative Commons Attribution License (https://creativecommons.org/licenses/by/4.0), which permits unrestricted use, distribution, and reproduction in any medium, provided the original work is properly cited.
This article is published in open access under the Subscribe to Open model. This email address is being protected from spambots. You need JavaScript enabled to view it. to support open access publication.
1 Introduction
Gravitationally lensed quasars are precious tools for astrophysical and cosmological studies. Identifying and characterising these lensed quasar systems is necessary for a broad range of applications, from time-delay cosmography to probing substructure in lensing galaxies. Specifically, there is now a division in the values of the Hubble–Lemaître constant (H0) into local Universe values around 73 km/s/Mpc and cosmic-microwave-background-based values near 67 km/s/Mpc. Lensed quasars could be an important element in resolving or understanding the tension in the Hubble–Lemaître constant (Colaço 2025; Freedman 2021). Until now, only a few attempts have been made to estimate H0 in this way (Wong et al. 2020) due to the required precision and the need for a lens model.
The Gaia satellite (Gaia Collaboration 2016) of the European Space Agency (ESA) repeatedly covers the entire sky at high angular resolution, obtaining photometry and spectra. In addition to the precise astrometry for which the mission was designed, Gaia can detect images of lensed quasars even at very small separations (∼250 mas) and obtain repeated measurements of their fluxes.
In 2018, the Gaia GraL Gravitational Lens search team released the first version of a catalogue compiling known gravitationally lensed quasars from the literature (Ducourant et al. 2018) as a reference set for both statistical studies and machine-learning validation. The ever-growing number of lensed quasars and the availability of Gaia Data Release 3 (DR3; Gaia Collaboration 2023b, 2021a,b) and the recent Focus Product Release (FPR; Gaia Collaboration 2024) motivated the construction of a new catalogue presenting the accurate Gaia astrometry and new products related to the lenses.
The new catalogue now contains all the spectroscopically confirmed gravitationally lensed quasars we could find in the literature. Gaia DR3 and FPR astrometry and photometry, as well as available redshifts from Gaia and the Milliquas catalogue (Flesch 2023), are included. A literature search resulted in a list of the time delays from the image pairs. The catalogue produced in this work gathers these data and is designed to support modelling efforts and to serve as a validation benchmark, and/or training set, for lens searches in current and forthcoming sky surveys.
Section 2 presents the content of the catalogue of lensed quasars. Section 3 describes the matching of the lenses with the Gaia DR3 and FPR. Section 4 provides the redshifts of the lensed quasars and the deflecting galaxies. The compilation of time delays is presented in Sect. 5, and the modelling of the quads fully measured by Gaia DR3 is presented in Sect. 6.
2 The catalogue
The current catalogue was compiled by combining the confirmed lenses from the first version of the catalogue (see Ducourant et al. 2018 for the origin of the data) with all discoveries published since 2018, as extensively referenced in the footnote of Table A.1. We provide a comprehensive list of spectroscopically confirmed lenses together with their corresponding discovery publications. The size of the lenses, ranging from 0.2″ to 59.9″, is also provided. For each component of every lens, we include the Gaia astrometry – that is, absolute coordinates rather than offsets relative to a reference. We therefore provide astrometric data from Gaia DR3, the Gaia FPR, and the discovery papers, and define the ‘best coordinates’ (ra_best, dec_best) parameters as follows: Gaia DR3 coordinates are used by default; if unavailable, Gaia FPR values are adopted; and if neither is available, we used the Hubble Space Telescope astrometry from Schmidt et al. (2023) if it exists. Finally, if none of these sources provides astrometry, the ‘best coordinates’ correspond to the values reported in the discovery paper. The origin of these ‘best’ coordinates is indicated in the ‘astrometry_best’ parameter.
The catalogue also provides redshifts from Milliquas (Flesch 2023), Gaia DR3 (QSOC redshifts; Delchambre et al. 2023), and the Southern-Hemisphere Spectroscopic Redshift Compilation (SHSRC; de Lima 2024). The discovery publications and the origin of redshifts are also indicated (see the footnote of Table A.1 for an extensive list of references). Finally, the catalogue includes all published time delays. These time delays have been carefully matched to the component numbering used in our dataset, saving the user the difficulty of cross-matching component identifications across multiple publications. Tables A.1 and B.1 present extracts of the catalogue. Additionally, a cross-match of the table has been performed with the AllWISE catalogue, and the (W1, W2, W3, W4) magnitudes, and errors are reported in our catalogue.
The first version of the catalogue (Ducourant et al. 2018) included 233 confirmed lenses from the literature from before 2018, of which 43 were quads. Candidate lenses were also included. However, many authors have since published extensive lists of candidates, most of which are unlikely to be confirmed. As a result, we now track only spectroscopically confirmed gravitational lens systems.
Figure 1 shows that the number of discoveries of lensed quasars has increased rapidly over time. The vertical lines indicate the Gaia data releases. Before Gaia DR1, the discovery rate was approximately 5–10 per year, but immediately after its second release, it increased to 40 per year and doubled again after DR3. Among the largest contributors to these discoveries are Lemon et al. (2018, 2019), Delchambre et al. (2019), Lemon et al. (2020, 2023), and Stern et al. (2021). This increase is not only due to the delivery of Gaia data but also to other large surveys published in the same years, for example that from the Dark Energy Spectroscopic Instrument (DESI; Duncan 2022).
The current catalogue contains 1 090 sources (quasar images and galaxies) distributed in 364 systems (80 quads, 7 triples, and 277 doublets). Figure D.1 provides charts for all the quads and triples with the identification of the A, B, C, and D components as well as deflecting galaxies.
The number of quads has almost doubled compared to the first release of the catalogue, and the number of doublets has increased by a factor of ∼1.5. An all-sky chart of the catalogue content is shown in galactic coordinates in Fig. 2.
The catalogue provides the user with the lens identifier, reference of the discovery paper, Gaia astrometry and photometry when a match was found in DR3 or FPR, and the redshifts of the quasar and the deflecting galaxy when available, either from the discovery paper or the literature. Additionally, the catalogue has also been cross-matched with major redshift catalogues such as Milliquas, Gaia DR3, and the SHSRC. Finally, colours from the AllWISE (Cutri et al. 2021) catalogue are also provided. An extract of the catalogue is shown in Table A.1, presenting the 18 quadruply imaged quasars fully measured by Gaia DR3 with selected properties.
The catalogue is available through the CDS, with access provided through Virtual Observatory-ready tools.
3 Match with Gaia data
3.1 Gaia DR3 and FPR
Gaia DR3 (Gaia Collaboration 2023b, 2021a,b) marks a milestone in ESA’s Gaia mission, with the publication of tables dedicated to quasar candidates and galaxy candidates (Gaia Collaboration 2023a; Ducourant et al. 2023). Released in 2022, Gaia DR3 provides positions, motions, fluxes, and spectroscopic information on nearly 1.8 billion celestial objects, including 6.6 million quasar candidates. However, the catalogue remains incomplete for small angular separations (Arenou et al. 2017, 2018; Fabricius et al. 2021; Torra et al. 2021), which are typical for most lenses, as was the case for DR2 and was expected for early mission products. This has led some known lensed quasar images to lack Gaia counterparts (see e.g. Ducourant et al. 2018).
A Gaia Data Processing and Analysis Consortium (DPAC) group has been working on a more complete catalogue of sources located in the immediate vicinity of a selection of 3.7 million candidate quasars. This effort resulted in the publication of the Gaia FPR, also known as the GravLens catalogue (Gaia Collaboration 2024). The catalogue includes the positions and magnitudes of 4.7 million sources detected within 6″ of the candidate quasars.
Gaia DR3 includes the positions (α, δ), parallaxes (ϖ), proper-motions (µα, µδ), and fluxes in the G, GBP, and GRP pass-bands (Riello et al. 2018) along with their uncertainties. We performed a positional cross-match within a maximum angular separation of 0.5″ between the astrometry found in the literature and the Gaia DR3 and FPR. From the 1090 individual sources (quasar images and galaxies) of our catalogue, 689 (63% ) are measured by Gaia. Of the 80 quads, 18 are fully detected with four images in Gaia DR3 and 23 with measurements coming from Gaia DR3 or FPR.
Several quads were not completely detected despite being within Gaia’s capabilities. For example, G2237+0305 has only two of its four components published in Gaia DR3, but the two missing components are indeed present in the Gaia FPR.
The FPR astrometry and photometry are known to be less accurate than DR3 data (Gaia Collaboration 2024), so one should consider FPR data only for sources not detected in DR3. The resolving power of the Gaia instrument is ∼0.2″, but the effective angular resolution of the Gaia DR3 is poorer, ∼0.3″. The current Gaia data cross-matching, astrometric solution validation, and filtering of possible spurious sources hinder the detection of the predicted ∼2900 lenses (Finet & Surdej 2016) that should be detected by the satellite. Each Gaia data release is expected to provide better effective resolution, and so merged systems in the Gaia DR3 may be separated in further data releases.
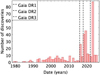 |
Fig. 1 Number of confirmed lensed quasars discovered per year. The lines correspond to the date of publication of Gaia DR1 (September 2016), DR2 (April 2018), and DR3 (June 2022). |
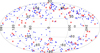 |
Fig. 2 All-sky chart in galactic coordinates of the lensed quasars from the catalogue. Quads are indicated with red crosses and doublets with blue dots. This full-sky map uses the Hammer–Aitoff projection in galactic coordinates, with l = b = 0 at the centre, north up, and l increasing from right to left. |
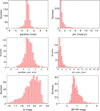 |
Fig. 3 Distributions of the astrometric and photometric parameters of sources matched with Gaia DR3. parallax_over_error and pm_over_error stand for the parameters divided by their errors. |
3.2 Properties
The statistics of the Gaia DR3 astrometric and photometric parameters are shown in Fig. 3. As expected, the distributions of proper motions and parallaxes are centred on null values, with standard deviations smaller than 1.3 mas for parallaxes and 1.5 mas/yr for proper motions. A few large values are, however, found (µα cos(δ)max = −14.6 ± 2.5 mas/yr, µδmax = −9.4 ± 0.8 mas/yr, and ϖmax = −23.8 ± 3.6 mas); this can be explained by the extended and diffuse structures of the sources, which can induce spurious parallaxes and proper motions (Gaia Collaboration 2023a; Makarov & Secrest 2022; Souchay et al. 2022). They are generally near the faint limit of the Gaia detection.
Based on the known lenses, one can develop astrometric filters to search for lenses in Gaia DR3. Catalogue sources have ϖ − 3σϖ < 4 mas/yr and | µ | − 3σµ < 4 mas/yr, where µ stands for both µα cos(δ) and µδ. These ‘soft’ cuts result in some stellar contamination when applied to Gaia data, but should not result in the rejection of many genuine lens systems. Similar cuts were applied in Krone-Martins et al. (2018), and also in a large, machine-learning-based, systematic blind search for lenses in Gaia DR2 (Delchambre et al. 2019).
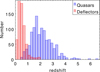 |
Fig. 4 Distribution of the spectroscopic redshifts of quasars and lensing galaxies collected from the literature (number per 0.2 redshift bins). |
4 Redshifts
We searched the literature for spectroscopic redshift information on the known gravitational lens systems (see the Table A.1 footnote for the full list of references). We also searched large redshift catalogues such as Milliquas (Flesch 2023), Gaia DR3 (Gaia Collaboration 2023a), and the SHSRC (de Lima 2024). We performed a 1″ positional match between the catalogue sources and these catalogues and kept the best match.
In total, we collected 347 redshifts of lensed quasars and 189 redshifts of deflecting galaxies. Figure 4 presents the distribution of the redshifts of the quasars and the lenses. The peak of the redshift distribution of quasars is at zsource ∼ 1.98, and the peak of deflecting galaxies is at zdeflector ∼ 0.45.
5 Time delays
A very promising approach to resolving the tension in the Hubble–Lemaître constant (Colaço 2025; Freedman 2021) is to use time delays between quasar images to measure absolute path differences for the light. The path length difference provides an absolute reference and hence a value for H0, the Hubble–Lemaître constant. The uncertainty in H0 arises from the uncertainty in the delay and in the model of the lens. Determinations of H0 range between the local Universe values of ∼73 km/s/Mpc and the cosmology-based Wilkinson Microwave Anisotropy Probe (WMAP) or Planck values of ∼67 km/s/Mpc. Time delays are measured when there is a characteristic flux variation that can be identified in two or more light curves, meaning that quasars with very weak flux variations will not have measurable time delays.
Long time delays are generally more useful for the determination of H0 because it is the fractional uncertainty that is relevant. With its ∼2000 days time series, Gaia should enormously increase the number of time delays and, in particular, long time delays in its forthcoming DR4. Gaia should complement ground-based observations, which have higher observing frequencies, generally shorter durations, and poorer angular resolution.
We searched the literature for published time delays of lensed quasars (see Table B.1 for the full list of references) and found 73 quasars with at least one measured time delay and a total of 195 individual delays, including within a new, unpublished quad, DESJ0029–3814 (Schechter, in prep.). These data are provided in Table B.1. Figure 5 shows the distribution of the time delays collected.
One can see that the peak of the distribution is around 20 days, and the largest values are around 2000 days. The number of time delays has increased rapidly recently, mostly thanks to the COSMOGRAIL and TDCOSMO publications (Millon et al. 2020b,c; Dux et al. 2025a).
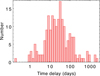 |
Fig. 5 Distributions of the values of time delays (|∆tAB|, |∆tAC|, …) for the known lenses listed in Table B.1. |
6 Modelling of the quads
Inferring H0 from time delays requires that the distribution of the mass along the line of sight be known (Treu et al. 2022). However, we can usually assume that the bending of the light occurs in a plane perpendicular to the observer-lensing galaxy direction, which contains all of its projected mass. This thin lens approximation provides us with simple models for the mass distribution projected onto the lens plane (see Keeton 2001 for the most commonly used mass models). For accuracy and homogeneity, we decided to model the 18 known quadruply imaged quasars for which all four images are available in Gaia DR3. We used as input the observed positions (xi, yi) and fluxes (fi) of the lensed images i ∈ {1, . . . , 4} that are reproduced using a singular isothermal ellipsoid (SIE) lens model (Kormann et al. 1994) in the presence of an external shear (Kovner 1987), hereafter the SIE+shear lens model. The predicted image positions ( ) and amplifications (
 ) associated with a given position of the source (xs, ys) were computed using the lenstronomy software (Birrer & Amara 2018). We summarise here the parameters of the SIE+shear lens model that are specific to the lenstronomy software; a more detailed description is presented in Birrer et al. (2021). The SIE+shear lens model is defined through a dimensionless surface mass density,
 (1)
(1)
where θE is the circularised Einstein radius; q is the ratio of the minor to the major axis; (xg, yg) is the position of the lensing galaxy; and (x, y) is a coordinate system respectively aligned with the minor and major axis of the lens. The system orientation (ϕ), shear orientation (ϕγ), and strength (γ) are related to the complex ellipticity moduli (ex, ey) and shear components (γx, γy) presented in Table C.1 through
 (2)
(2)
The parameters of the lens model are retrieved by minimising the chi-square:
 (3)
(3)
where  is the inverse covariance matrix on (xi, yi); fs is the original, non-lensed source flux; and
  are the uncertainties on fi. If we assume that all lensed images have valid positions and fluxes, then Eq. (3) has twelve constraints and ten free parameters, yielding two degrees of freedom. Using particle swarm optimisation, we found that the minimum of Eq. (3) (Kennedy & Eberhart 1995) first converges to an initial guess of the parameters, which were then refined using a burned-in Monte Carlo Markov chain (MCMC) sampler (Foreman-Mackey et al. 2013) that simultaneously provides the uncertainties on the final parameters. The SIE+shear lens model also requires fs > 0 and
  , while we further impose −0.5 < γx < 0.5 and −0.5 < γy < 0.5 such that
  .
.
The relatively large positional chi-squares observed in Table C.1 (median  ) can largely be explained by the very low astrometric uncertainty of Gaia (e.g. a median uncertainty of 0.27 mas in our sample) along with gravitational lensing effects that are not taken into account by the SIE+shear lens model: galaxy sub-structure, multiple deflectors, intervening galaxies along the line of sight, and micro-lensing. Micro-lensing, when combined with time delays and with the limitations of our model, is also the main cause of the large flux chi-squares (median
  ).
).
If we ignore the very low astrometric uncertainties of Gaia, most of the image positions are accurately reproduced by our model with a median root mean square (rms) error of 1.6 mas according to Table C.1. Notable exceptions are:
J1606-2333 (rms of 134 mas). Image C has loose constraints that permit a large rms with a reasonable χ2pos of 36.67. The main deflector also has a companion object near image C that can potentially explain the observed discrepancy (Shajib et al. 2019);
GraL065904.1+162909 (rms of 84 mas). This system is known to be complicated to model with a SIE+shear lens model and has a satellite object close to image D (Schmidt et al. 2023; Ertl et al. 2023; Stern et al. 2021);
B1422+231 (rms of 53 mas). Image D has large positional uncertainties of σx = 70 mas and σy = 46 mas, although its large
 of 450.13 comes from image B. Sluse et al. (2012) had to introduce a second lensing galaxy to properly model this system;
RXJ0911+0551 (rms of 37 mas). Images A and C are inaccurately reproduced owing to the presence of a small satellite galaxy (Kneib et al. 2000);
GraL081828.3-261325 (rms of 32 mas). Images C and D are inaccurately reproduced as the deflector presumably consists of a group or cluster of galaxies (Schmidt et al. 2023; Stern et al. 2021);
2MASSJ13102005-1714579 (rms of 22 mas). Images B and C are inaccurately reproduced as this system has two noticeable lensing galaxies (see Appendix D.1).
All other systems have an rms of less than 7 mas. We should note here that the presence of multiple deflectors does not imply that the image positions are inaccurately reproduced since, for example, the cluster-lensed system SDSS1004+4112 has an rms of 0.2 mas. We finally compared the predicted position of the deflector to the position of the photo-centre provided in our catalogue for 11 systems and found a rather good agreement, of the order of 500 mas, with the exception of SDSS1004+4112, where a shift of 1.4″ is observed due to its wide separation and due to the fact that the deflector is composed of a cluster of galaxies. These differences, along with the discrepant values of the SIE+shear parameters we obtained compared to literature values, mainly come from the fact that we voluntarily do not artificially inflate the uncertainties on the observed fluxes, as is commonly done in lens modelling to compensate for the effect of micro-lensing, time delays, and galaxy sub-structures.
Accordingly, more sophisticated models exist in the literature that we do not aim to compete with. When available, these models should be preferred to the simple SIE+shear model presented here. A non-exhaustive list of such models can be found in Schmidt et al. (2023) for the quads with indices 1, 3, 4, 8, 13, 15, 17, and 18 in Table C.1; Ertl et al. (2023) for 3, 10, 13, and 15; Stern et al. (2021) for 3, 5, 9, and 15; Rusu et al. (2020) for 16; Shajib et al. (2019) for 1, 14, and 18; Lucey et al. (2018) for 11; Wong et al. (2017) for 2; Sluse et al. (2012) for 5, 7, and 12; Chantry et al. (2010) for 2 and 10; and Williams & Saha (2004) for 6.
7 Conclusions
We provide a comprehensive catalogue containing the most relevant information for each known lensed quasar and its components, including the best absolute astrometry, redshifts, and time delays available. The catalogue comprises 364 spectroscopically confirmed lensed systems, including 80 quadruply imaged quasars, 7 triply imaged quasars, and 277 doublets, along with precise astrometric data for 218 deflecting galaxies. The catalogue incorporates positional and photometric information from Gaia DR3 and the GravLens FPR, the best absolute positions currently available.
Redshifts for 347 quasars and 188 lensing galaxies have been compiled from the literature and major spectroscopic catalogues. We also include a curated set of 195 published individual time delays for 73 lensed systems. This information is essential for any further adoption of these data for time-delay cosmography, particularly in light of the forthcoming extended time-series data from Gaia DR4 (2026).
A new important product of our catalogue is a list of published time delays that have been matched to the catalogue and correctly associated with the various components.
We also provide simple but homogeneous lens modelling for 18 quads with complete astrometric and photometric coverage in Gaia DR3, using an SIE+external shear framework. While residuals highlight the limits of such simplified mass models, they nonetheless offer a robust baseline for lens configuration studies and training data for automated lens-finding algorithms.
The new catalogue serves a dual role: as a benchmark for validating machine-learning classifiers in lens searches, and as ready-to-use input for strong lensing models and cosmological applications.
Data availability
The full versions of Table A.1 (confirmed multiply imaged quasars and properties) and Table B.1 (time delays) are available at the CDS via https://cdsarc.cds.unistra.fr/viz-bin/cat/J/A+A/707/A345
Acknowledgements
We acknowledge support from ‘Observatoire Aquitain des Sciences de l’Univers (OASU)’, from ‘Service National d’Observation (SNO) Gaia’, and from ‘Actions sur projet INSU-PNGRAM’. The authors wish to acknowledge support from the ESA PRODEX Programme ‘Gaia-DPAC QSOs’ and from the Belgian Federal Science Policy Office. The authors acknowledge support from the FAPESP (Fundação de Amparo à Pesquisa do Estado de São Paulo) and S-Plus collaboration. This research has made use of the VizieR catalogue access tool, CDS, Strasbourg, France. The original description of the VizieR service was published in A&AS 143, 23. This research has made use of “Aladin sky atlas” developed at CDS, Strasbourg Observatory, France. This work has made use of results from the ESA space mission Gaia, the data from which were processed by the Gaia Data Processing and Analysis Consortium (DPAC). Funding for the DPAC has been provided by national institutions, in particular the institutions participating in the Gaia Multilateral Agreement. The Gaia mission website is: http://www.cosmos.esa.int/gaia. Some of the authors are members of the Gaia Data Processing and Analysis Consortium (DPAC). This research is based on observations made with the NASA/ESA Hubble Space Telescope obtained from the Space Telescope Science Institute, which is operated by the Association of Universities for Research in Astronomy, Inc., under NASA contract NAS 5–26555. The Pan-STARRS1 Surveys (PS1) and the PS1 public science archive have been made possible through contributions by the Institute for Astronomy, the University of Hawaii, the Pan-STARRS Project Office, the Max-Planck Society and its participating institutes, the Max Planck Institute for Astronomy, Heidelberg and the Max Planck Institute for Extraterrestrial Physics, Garching, The Johns Hopkins University, Durham University, the University of Edinburgh, the Queen’s University Belfast, the Harvard-Smithsonian Center for Astrophysics, the Las Cumbres Observatory Global Telescope Network Incorporated, the National Central University of Taiwan, the Space Telescope Science Institute, the National Aeronautics and Space Administration under Grant No. NNX08AR22G issued through the Planetary Science Division of the NASA Science Mission Directorate, the National Science Foundation Grant No. AST–1238877, the University of Maryland, Eotvos Lorand University (ELTE), the Los Alamos National Laboratory, and the Gordon and Betty Moore Foundation. This work is based [in part] on observations made with the NASA/ESA/CSA James Webb Space Telescope. The data were obtained from the Mikulski Archive for Space Telescopes at the Space Telescope Science Institute, which is operated by the Association of Universities for Research in Astronomy, Inc., under NASA contract NAS 5-03127 for JWST. DESI construction and operations is managed by the Lawrence Berkeley National Laboratory. This research is supported by the U.S. Department of Energy, Office of Science, Office of High-Energy Physics, under Contract No. DE–AC02–05CH11231, and by the National Energy Research Scientific Computing Center, a DOE Office of Science User Facility under the same contract. Additional support for DESI is provided by the U.S. National Science Foundation, Division of Astronomical Sciences under Contract No. AST-0950945 to the NSF’s National Optical-Infrared Astronomy Research Laboratory; the Science and Technology Facilities Council of the United Kingdom; the Gordon and Betty Moore Foundation; the Heising-Simons Foundation; the French Alternative Energies and Atomic Energy Commission (CEA); the National Council of Science and Technology of Mexico (CONACYT); the Ministry of Science and Innovation of Spain, and by the DESI Member Institutions. The DESI collaboration is honored to be permitted to conduct astronomical research on Iolkam Du’ag (Kitt Peak), a mountain with particular significance to the Tohono O’odham Nation. This research is based [in part] on data collected at the Subaru Telescope, which is operated by the National Astronomical Observatory of Japan. We are honored and grateful for the opportunity of observing the Universe from Maunakea, which has the cultural, historical, and natural significance in Hawaii.
References
- Acebron, A., Grillo, C., Suyu, S. H., et al. 2024, ApJ, 976, 110 [Google Scholar]
- Aghamousa, A., & Shafieloo, A. 2017, ApJ, 834, 31 [Google Scholar]
- Agnello, A., Treu, T., Ostrovski, F., et al. 2015, MNRAS, 454, 1260 [Google Scholar]
- Agnello, A., Grillo, C., Jones, T., et al. 2018a, MNRAS, 474, 3391 [CrossRef] [Google Scholar]
- Agnello, A., Lin, H., Kuropatkin, N., et al. 2018b, MNRAS, 479, 4345 [Google Scholar]
- Agnello, A., Schechter, P. L., Morgan, N. D., et al. 2018c, MNRAS, 475, 2086 [Google Scholar]
- Akhunov, T. A., Wertz, O., Elyiv, A., et al. 2017, MNRAS, 465, 3607 [Google Scholar]
- Anguita, T., Faure, C., Kneib, J. P., et al. 2009, A&A, 507, 35 [NASA ADS] [CrossRef] [EDP Sciences] [Google Scholar]
- Anguita, T., Schechter, P. L., Kuropatkin, N., et al. 2018, MNRAS, 480, 5017 [NASA ADS] [Google Scholar]
- Arenou, F., Luri, X., Babusiaux, C., et al. 2017, A&A, 599, A50 [NASA ADS] [CrossRef] [EDP Sciences] [Google Scholar]
- Arenou, F., Luri, X., Babusiaux, C., et al. 2018, A&A, 616, A17 [NASA ADS] [CrossRef] [EDP Sciences] [Google Scholar]
- Argo, M. K., Jackson, N. J., Browne, I. W. A., et al. 2003, MNRAS, 338, 957 [NASA ADS] [CrossRef] [Google Scholar]
- Augusto, P., Browne, I. W. A., Wilkinson, P. N., et al. 2001, MNRAS, 326, 1007 [Google Scholar]
- Bade, N., Siebert, J., Lopez, S., Voges, W., & Reimers, D. 1997, A&A, 317, L13 [NASA ADS] [Google Scholar]
- Beauchemin, M., & Borra, E. F. 1992, AJ, 103, 405 [Google Scholar]
- Bekov, D. K., Akhunov, T. A., Burkhonov, O. A., & Alimova, N. R. 2024, Astrophys. Bull., 79, 15 [Google Scholar]
- Berghea, C. T., Nelson, G. J., Rusu, C. E., Keeton, C. R., & Dudik, R. P. 2017, ApJ, 844, 90 [NASA ADS] [CrossRef] [Google Scholar]
- Biggs, A. D. 2018, MNRAS, 481, 1000 [NASA ADS] [CrossRef] [Google Scholar]
- Biggs, A. D. 2021, MNRAS, 505, 2610 [NASA ADS] [CrossRef] [Google Scholar]
- Biggs, A. D., & Browne, I. W. A. 2018, MNRAS, 476, 5393 [CrossRef] [Google Scholar]
- Biggs, A. D., Rusin, D., Browne, I. W. A., et al. 2003, MNRAS, 338, 1084 [Google Scholar]
- Birrer, S., & Amara, A. 2018, Phys. Dark Universe, 22, 189 [NASA ADS] [CrossRef] [Google Scholar]
- Birrer, S., Shajib, A., Gilman, D., et al. 2021, J. Open Source Softw., 6, 3283 [NASA ADS] [CrossRef] [Google Scholar]
- Blackburne, J. A., Wisotzki, L., & Schechter, P. L. 2008, AJ, 135, 374 [Google Scholar]
- Bonvin, V., Chan, J. H. H., Millon, M., et al. 2018, A&A, 616, A183 [NASA ADS] [CrossRef] [EDP Sciences] [Google Scholar]
- Bonvin, V., Millon, M., Chan, J. H. H., et al. 2019, A&A, 629, A97 [NASA ADS] [CrossRef] [EDP Sciences] [Google Scholar]
- Browne, I. W. A., Patnaik, A. R., Walsh, D., & Wilkinson, P. N. 1993, MNRAS, 263, L32 [Google Scholar]
- Burkhonov, O. A., Shalyapin, V. N., Sergeyev, A. V., et al. 2026, MNRAS, 546, stag023 [Google Scholar]
- Carnerero, M. I., Raiteri, C. M., Rimoldini, L., et al. 2023, A&A, 674, A24 [NASA ADS] [CrossRef] [EDP Sciences] [Google Scholar]
- Castander, F. J., Treister, E., Maza, J., & Gawiser, E. 2006, ApJ, 652, 955 [Google Scholar]
- Chan, J. H. H., Lemon, C., Courbin, F., et al. 2022, A&A, 659, A140 [NASA ADS] [CrossRef] [EDP Sciences] [Google Scholar]
- Chantry, V., Sluse, D., & Magain, P. 2010, A&A, 522, A95 [NASA ADS] [CrossRef] [EDP Sciences] [Google Scholar]
- Chavushyan, V. H., Vlasyuk, V. V., Stepanian, J. A., & Erastova, L. K. 1997, A&A, 318, L67 [NASA ADS] [Google Scholar]
- Chen, Y.-C., Hwang, H.-C., Shen, Y., et al. 2022, ApJ, 925, 162 [NASA ADS] [CrossRef] [Google Scholar]
- Claeskens, J.-F., & Surdej, J. 2002, A&A Rev., 10, 263 [Google Scholar]
- Claeskens, J. F., Surdej, J., & Remy, M. 1996, A&A, 305, L9 [Google Scholar]
- Cloonan, A. P., Khullar, G., Napier, K. A., et al. 2024, arXiv e-prints [arXiv:2408.03379] [Google Scholar]
- Colaço, L. R. 2025, Universe, 11, 89 [Google Scholar]
- Courbin, F., Tewes, M., Djorgovski, S. G., et al. 2010, A&A, 516, L12 [NASA ADS] [CrossRef] [EDP Sciences] [Google Scholar]
- Courbin, F., Bonvin, V., Buckley-Geer, E., et al. 2018, A&A, 609, A71 [NASA ADS] [CrossRef] [EDP Sciences] [Google Scholar]
- Cox, P., Omont, A., Djorgovski, S. G., et al. 2002, A&A, 387, 406 [NASA ADS] [CrossRef] [EDP Sciences] [Google Scholar]
- Crampton, D., Le Fevre, O., Hammer, F., & Lilly, S. J. 1996, A&A, 307, L53 [Google Scholar]
- Cutri, R. M., Wright, E. L., Conrow, T., et al. 2021, VizieR Online Data Catalog: AllWISE Data Release (Cutri+ 2013), VizieR On-line Data Catalog: II/328. Originally published in: IPAC/Caltech (2013) [Google Scholar]
- Dahle, H., Gladders, M. D., Sharon, K., et al. 2013, ApJ, 773, 146 [NASA ADS] [CrossRef] [Google Scholar]
- Dahle, H., Gladders, M. D., Sharon, K., Bayliss, M. B., & Rigby, J. R. 2015, ApJ, 813, 67 [NASA ADS] [CrossRef] [Google Scholar]
- Dawes, C., Storfer, C., Huang, X., et al. 2023, ApJS, 269, 61 [NASA ADS] [CrossRef] [Google Scholar]
- de Lima, E. V. R. 2024, ErikVini/specz_compilation: Southern Hemisphere Spectrocopic Redshift Compilation [Google Scholar]
- Delchambre, L., Krone-Martins, A., Wertz, O., et al. 2019, A&A, 622, A165 [NASA ADS] [CrossRef] [EDP Sciences] [Google Scholar]
- Delchambre, L., Bailer-Jones, C. A. L., Bellas-Velidis, I., et al. 2023, A&A, 674, A31 [NASA ADS] [CrossRef] [EDP Sciences] [Google Scholar]
- Desira, C., Shu, Y., Auger, M. W., et al. 2022, MNRAS, 509, 738 [Google Scholar]
- Ducourant, C., Wertz, O., Krone-Martins, A., et al. 2018, A&A, 618, A56 [NASA ADS] [CrossRef] [EDP Sciences] [Google Scholar]
- Ducourant, C., Krone-Martins, A., Galluccio, L., et al. 2023, A&A, 674, A11 [NASA ADS] [CrossRef] [EDP Sciences] [Google Scholar]
- Duncan, K. J. 2022, MNRAS, 512, 3662 [NASA ADS] [CrossRef] [Google Scholar]
- Dux, F., Lemon, C., Courbin, F., et al. 2024, A&A, 682, A47 [NASA ADS] [CrossRef] [EDP Sciences] [Google Scholar]
- Dux, F., Millon, M., Galan, A., et al. 2025a, A&A, 697, A139 [NASA ADS] [CrossRef] [EDP Sciences] [Google Scholar]
- Dux, F., Millon, M., Lemon, C., et al. 2025b, A&A, 694, A300 [NASA ADS] [CrossRef] [EDP Sciences] [Google Scholar]
- Dux, F., Lemon, C., Courbin, F., et al. 2023, A&A, 679, L4 [NASA ADS] [CrossRef] [EDP Sciences] [Google Scholar]
- Eigenbrod, A., Courbin, F., Dye, S., et al. 2006a, A&A, 451, 747 [NASA ADS] [CrossRef] [EDP Sciences] [Google Scholar]
- Eigenbrod, A., Courbin, F., Meylan, G., Vuissoz, C., & Magain, P. 2006b, A&A, 451, 759 [NASA ADS] [CrossRef] [EDP Sciences] [Google Scholar]
- Eigenbrod, A., Courbin, F., & Meylan, G. 2007, A&A, 465, 51 [NASA ADS] [CrossRef] [EDP Sciences] [Google Scholar]
- Ertl, S., Schuldt, S., Suyu, S. H., et al. 2023, A&A, 672, A2 [NASA ADS] [CrossRef] [EDP Sciences] [Google Scholar]
- Eulaers, E., & Magain, P. 2011, A&A, 536, A44 [NASA ADS] [CrossRef] [EDP Sciences] [Google Scholar]
- Eulaers, E., Tewes, M., Magain, P., et al. 2013, A&A, 553, A121 [NASA ADS] [CrossRef] [EDP Sciences] [Google Scholar]
- Fabricius, C., Luri, X., Arenou, F., et al. 2021, A&A, 649, A5 [NASA ADS] [CrossRef] [EDP Sciences] [Google Scholar]
- Fan, X., Wang, F., Yang, J., et al. 2019, ApJ, 870, L11 [Google Scholar]
- Fassnacht, C. D., & Cohen, J. G. 1998, AJ, 115, 377 [NASA ADS] [CrossRef] [Google Scholar]
- Fassnacht, C. D., Womble, D. S., Neugebauer, G., et al. 1996, ApJ, 460, L103 [Google Scholar]
- Fassnacht, C. D., Blandford, R. D., Cohen, J. G., et al. 1999, AJ, 117, 658 [NASA ADS] [CrossRef] [Google Scholar]
- Fassnacht, C. D., Xanthopoulos, E., Koopmans, L. V. E., & Rusin, D. 2002, ApJ, 581, 823 [NASA ADS] [CrossRef] [Google Scholar]
- Fian, C., Muñoz, J. A., Jiménez-Vicente, J., et al. 2024, A&A, 689, A129 [NASA ADS] [CrossRef] [EDP Sciences] [Google Scholar]
- Finet, F., & Surdej, J. 2016, A&A, 590, A42 [NASA ADS] [CrossRef] [EDP Sciences] [Google Scholar]
- Fischer, P., Schade, D., & Barrientos, L. F. 1998, ApJ, 503, L127 [Google Scholar]
- Flesch, E. W. 2023, Open J. Astrophys., 6, 49 [NASA ADS] [CrossRef] [Google Scholar]
- Fohlmeister, J., Kochanek, C. S., Falco, E. E., et al. 2013, ApJ, 764, 186 [NASA ADS] [CrossRef] [Google Scholar]
- Foreman-Mackey, D., Conley, A., Meierjurgen Farr, W., et al. 2013, emcee: The MCMC Hammer, Astrophysics Source Code Library [record ascl:1303.002] [Google Scholar]
- Freedman, W. L. 2021, ApJ, 919, 16 [NASA ADS] [CrossRef] [Google Scholar]
- Furtak, L. J., Mainali, R., Zitrin, A., et al. 2023, MNRAS, 522, 5142 [Google Scholar]
- Furtak, L. J., Secunda, A. R., Greene, J. E., et al. 2025, A&A, 698, A227 [NASA ADS] [CrossRef] [EDP Sciences] [Google Scholar]
- Gaia Collaboration (Prusti, T., et al.) 2016, A&A, 595, A1 [NASA ADS] [CrossRef] [EDP Sciences] [Google Scholar]
- Gaia Collaboration (Brown, A. G. A., et al.) 2021a, A&A, 649, A1 [NASA ADS] [CrossRef] [EDP Sciences] [Google Scholar]
- Gaia Collaboration (Brown, A. G. A., et al.) 2021b, A&A, 650, C3 [EDP Sciences] [Google Scholar]
- Gaia Collaboration (Bailer-Jones, C. A. L., et al.) 2023a, A&A, 674, A41 [NASA ADS] [CrossRef] [EDP Sciences] [Google Scholar]
- Gaia Collaboration (Vallenari, A., et al.) 2023b, A&A, 674, A1 [NASA ADS] [CrossRef] [EDP Sciences] [Google Scholar]
- Gaia Collaboration (Krone-Martins, A., et al.) 2024, A&A, 685, A130 [NASA ADS] [CrossRef] [EDP Sciences] [Google Scholar]
- Gil-Merino, R., Goicoechea, L. J., Shalyapin, V. N., & Oscoz, A. 2018, A&A, 616, A118 [NASA ADS] [CrossRef] [EDP Sciences] [Google Scholar]
- Glikman, E., Rusu, C. E., Chen, G. C. F., et al. 2023, ApJ, 943, 25 [NASA ADS] [CrossRef] [Google Scholar]
- Goicoechea, L. J., & Shalyapin, V. N. 2016, A&A, 596, A77 [NASA ADS] [CrossRef] [EDP Sciences] [Google Scholar]
- Gross, A. C., Chen, Y.-C., Foord, A., et al. 2023, ApJ, 956, 117 [NASA ADS] [CrossRef] [Google Scholar]
- Gross, A. C., Chen, Y.-C., Oguri, M., et al. 2024, arXiv e-prints [arXiv:2409.16363] [Google Scholar]
- Gross, A. C., Chen, Y.-C., Oguri, M., et al. 2025, ApJ, 989, 112 [Google Scholar]
- Hagen, H. J., & Reimers, D. 2000, A&A, 357, L29 [Google Scholar]
- Hainline, L. J., Morgan, C. W., MacLeod, C. L., et al. 2013, ApJ, 774, 69 [NASA ADS] [CrossRef] [Google Scholar]
- Hawkins, M. R. S. 2021, MNRAS, 503, 3848 [Google Scholar]
- He, Z., Chen, Q., Deng, L., et al. 2025a, A&A, 695, A76 [NASA ADS] [CrossRef] [EDP Sciences] [Google Scholar]
- He, Z., Chen, Q., Li, S., Li, N., & Huang, X. 2025b, arXiv e-prints [arXiv:2509.03858] [Google Scholar]
- Hewitt, J. N., Turner, E. L., Lawrence, C. R., Schneider, D. P., & Brody, J. P. 1992, AJ, 104, 968 [Google Scholar]
- Huchra, J., Gorenstein, M., Kent, S., et al. 1985, AJ, 90, 691 [NASA ADS] [CrossRef] [Google Scholar]
- Inada, N., Becker, R. H., Burles, S., et al. 2003a, AJ, 126, 666 [NASA ADS] [CrossRef] [Google Scholar]
- Inada, N., Oguri, M., Pindor, B., et al. 2003b, Nature, 426, 810 [NASA ADS] [CrossRef] [Google Scholar]
- Inada, N., Burles, S., Gregg, M. D., et al. 2005, AJ, 130, 1967 [Google Scholar]
- Inada, N., Oguri, M., Becker, R. H., et al. 2006a, AJ, 131, 1934 [Google Scholar]
- Inada, N., Oguri, M., Morokuma, T., et al. 2006b, ApJ, 653, L97 [Google Scholar]
- Inada, N., Oguri, M., Becker, R. H., et al. 2007, AJ, 133, 206 [Google Scholar]
- Inada, N., Oguri, M., Shin, M.-S., et al. 2012, AJ, 143, 119 [Google Scholar]
- Inada, N., Oguri, M., Rusu, C. E., Kayo, I., & Morokuma, T. 2014, AJ, 147, 153 [Google Scholar]
- Irwin, M. J., Ibata, R. A., Lewis, G. F., & Totten, E. J. 1998, ApJ, 505, 529 [NASA ADS] [CrossRef] [Google Scholar]
- Jackson, N., de Bruyn, A. G., Myers, S., et al. 1995, MNRAS, 274, L25 [NASA ADS] [CrossRef] [Google Scholar]
- Jackson, N., Ofek, E. O., & Oguri, M. 2008, MNRAS, 387, 741 [Google Scholar]
- Jackson, N., Rampadarath, H., Ofek, E. O., Oguri, M., & Shin, M.-S. 2012, MNRAS, 419, 2014 [NASA ADS] [CrossRef] [Google Scholar]
- Jackson, N., Badole, S., Dugdale, T., et al. 2024, MNRAS, 530, 221 [NASA ADS] [CrossRef] [Google Scholar]
- Jaelani, A. T., Rusu, C. E., Kayo, I., et al. 2021, MNRAS, 502, 1487 [NASA ADS] [CrossRef] [Google Scholar]
- Jalan, P., Negi, V., Surdej, J., et al. 2024, Bull. Soc. Roy. Sci. Liege, 93, 752 [Google Scholar]
- Johnston, D. E., Richards, G. T., Frieman, J. A., et al. 2003, AJ, 126, 2281 [Google Scholar]
- Kayo, I., Inada, N., Oguri, M., et al. 2010, AJ, 139, 1614 [NASA ADS] [CrossRef] [Google Scholar]
- Keeley, R. E., Nierenberg, A. M., Gilman, D., et al. 2024, MNRAS, 535, 1652 [Google Scholar]
- Keeton, C. R. 2001, arXiv e-prints [arXiv:astro-ph/0102341] [Google Scholar]
- Kennedy, J., & Eberhart, R. 1995, Proceedings of ICNN’95 – International Conference on Neural Networks, 4, 1942 [CrossRef] [Google Scholar]
- Kneib, J.-P., Cohen, J. G., & Hjorth, J. 2000, ApJ, 544, L35 [Google Scholar]
- Kochanek, C. S., Falco, E. E., Schild, R., Dobrzycki, A., & Hagen, H.-J. 1997, ApJ, 479, 678 [Google Scholar]
- Koopmans, L. V. E., de Bruyn, A. G., Marlow, D. R., et al. 1999, MNRAS, 303, 727 [Google Scholar]
- Kormann, R., Schneider, P., & Bartelmann, M. 1994, A&A, 284, 285 [NASA ADS] [Google Scholar]
- Kostrzewa-Rutkowska, Z., Kozłowski, S., Lemon, C., et al. 2018, MNRAS, 476, 663 [NASA ADS] [CrossRef] [Google Scholar]
- Kovner, I. 1987, ApJ, 312, 22 [Google Scholar]
- Krone-Martins, A., Delchambre, L., Wertz, O., et al. 2018, A&A, 616, L11 [NASA ADS] [CrossRef] [EDP Sciences] [Google Scholar]
- Krone-Martins, A., Graham, M. J., Stern, D., et al. 2019, arXiv e-prints [arXiv:1912.08977] [Google Scholar]
- Lacy, M., Gregg, M., Becker, R. H., et al. 2002, AJ, 123, 2925 [Google Scholar]
- Langston, G. I., Schneider, D. P., Conner, S., et al. 1989, AJ, 97, 1283 [Google Scholar]
- Lehar, J., Burke, B. F., Conner, S. R., et al. 1997, AJ, 114, 48 [NASA ADS] [CrossRef] [Google Scholar]
- Lemon, C. A., Auger, M. W., McMahon, R. G., & Ostrovski, F. 2018, MNRAS, 479, 5060 [Google Scholar]
- Lemon, C. A., Auger, M. W., & McMahon, R. G. 2019, MNRAS, 483, 4242 [NASA ADS] [CrossRef] [Google Scholar]
- Lemon, C., Auger, M. W., McMahon, R., et al. 2020, MNRAS, 494, 3491 [NASA ADS] [CrossRef] [Google Scholar]
- Lemon, C., Anguita, T., Auger-Williams, M.W., et al. 2023, MNRAS, 520, 3305 [NASA ADS] [CrossRef] [Google Scholar]
- Li, J., Liu, X., Shen, Y., et al. 2023, ApJ, 955, L16 [CrossRef] [Google Scholar]
- Lidman, C., Courbin, F., Kneib, J. P., et al. 2000, A&A, 364, L62 [Google Scholar]
- Lin, H., Buckley-Geer, E., Agnello, A., et al. 2017, ApJ, 838, L15 [CrossRef] [Google Scholar]
- Lubin, L. M., Fassnacht, C. D., Readhead, A. C. S., Blandford, R. D., & Kundić, T. 2000, AJ, 119, 451 [NASA ADS] [CrossRef] [Google Scholar]
- Lucey, J. R., Schechter, P. L., Smith, R. J., & Anguita, T. 2018, MNRAS, 476, 927 [NASA ADS] [CrossRef] [Google Scholar]
- Magain, P., Surdej, J., Swings, J. P., Borgeest, U., & Kayser, R. 1988, Nature, 334, 325 [NASA ADS] [CrossRef] [Google Scholar]
- Makarov, V. V., & Secrest, N. J. 2022, ApJ, 933, 28 [NASA ADS] [CrossRef] [Google Scholar]
- Marlow, D. R., Myers, S. T., Rusin, D., et al. 1999, AJ, 118, 654 [Google Scholar]
- Marlow, D. R., Rusin, D., Norbury, M., et al. 2001, AJ, 121, 619 [Google Scholar]
- Martinez, M. N., Napier, K. A., Cloonan, A. P., et al. 2023, ApJ, 946, 63 [NASA ADS] [CrossRef] [Google Scholar]
- McGreer, I. D., Hall, P. B., Fan, X., et al. 2010, AJ, 140, 370 [Google Scholar]
- McKean, J. P., Koopmans, L. V. E., Browne, I. W. A., et al. 2004, MNRAS, 350, 167 [NASA ADS] [CrossRef] [Google Scholar]
- McKean, J. P., Browne, I. W. A., Jackson, N. J., et al. 2005, MNRAS, 356, 1009 [Google Scholar]
- McMahon, R., Irwin, M., & Hazard, C. 1992, GEMINI Newslett. Roy. Greenwich Observ., 36, 1 [Google Scholar]
- Meyer, A. D., van Dyk, D. A., Tak, H., & Siemiginowska, A. 2023, ApJ, 950, 37 [Google Scholar]
- Millon, M., Courbin, F., Bonvin, V., et al. 2020a, A&A, 642, A193 [NASA ADS] [CrossRef] [EDP Sciences] [Google Scholar]
- Millon, M., Courbin, F., Bonvin, V., et al. 2020b, A&A, 640, A105 [NASA ADS] [CrossRef] [EDP Sciences] [Google Scholar]
- Millon, M., Galan, A., Courbin, F., et al. 2020c, A&A, 639, A101 [NASA ADS] [CrossRef] [EDP Sciences] [Google Scholar]
- More, A., Oguri, M., Kayo, I., et al. 2016, MNRAS, 456, 1595 [NASA ADS] [CrossRef] [Google Scholar]
- More, A., Lee, C.-H., Oguri, M., et al. 2017, MNRAS, 465, 2411 [NASA ADS] [CrossRef] [Google Scholar]
- Morgan, N. D., Dressler, A., Maza, J., Schechter, P. L., & Winn, J. N. 1999, AJ, 118, 1444 [NASA ADS] [CrossRef] [Google Scholar]
- Morgan, N. D., Becker, R. H., Gregg, M. D., Schechter, P. L., & White, R. L. 2001, AJ, 121, 611 [Google Scholar]
- Morgan, N. D., Gregg, M. D., Wisotzki, L., et al. 2003a, AJ, 126, 696 [NASA ADS] [CrossRef] [Google Scholar]
- Morgan, N. D., Snyder, J. A., & Reens, L. H. 2003b, AJ, 126, 2145 [Google Scholar]
- Morgan, C. W., Eyler, M. E., Kochanek, C. S., et al. 2008, ApJ, 676, 80 [NASA ADS] [CrossRef] [Google Scholar]
- Morokuma, T., Inada, N., Oguri, M., et al. 2007, AJ, 133, 214 [NASA ADS] [CrossRef] [Google Scholar]
- Mozumdar, P., Fassnacht, C. D., Treu, T., Spiniello, C., & Shajib, A. J. 2023, A&A, 672, A20 [NASA ADS] [CrossRef] [EDP Sciences] [Google Scholar]
- Muñoz, J. A., Kochanek, C. S., Fohlmeister, J., et al. 2022, ApJ, 937, 34 [CrossRef] [Google Scholar]
- Muller, S., Martí-Vidal, I., Combes, F., et al. 2023, A&A, 674, A101 [NASA ADS] [CrossRef] [EDP Sciences] [Google Scholar]
- Myers, S. T., Fassnacht, C. D., Djorgovski, S. G., et al. 1995, ApJ, 447, L5 [NASA ADS] [CrossRef] [Google Scholar]
- Myers, S. T., Rusin, D., Fassnacht, C. D., et al. 1999, AJ, 117, 2565 [Google Scholar]
- Napier, K., Gladders, M. D., Sharon, K., et al. 2023, ApJ, 954, L38 [NASA ADS] [CrossRef] [Google Scholar]
- Narasimha, D., Subramanian, K., & Chitre, S. M. 1984, ApJ, 283, 512 [Google Scholar]
- Núñez-Pizarro, C., Arévalo, P., Ávila-Vera, F., & Motta, V. 2026, A&A, 706, L12 [NASA ADS] [CrossRef] [EDP Sciences] [Google Scholar]
- Ofek, E. O., Maoz, D., Rix, H.-W., Kochanek, C. S., & Falco, E. E. 2006, ApJ, 641, 70 [NASA ADS] [CrossRef] [Google Scholar]
- Oguri, M., Inada, N., Castander, F. J., et al. 2004, PASJ, 56, 399 [NASA ADS] [Google Scholar]
- Oguri, M., Inada, N., Hennawi, J. F., et al. 2005, ApJ, 622, 106 [Google Scholar]
- Oguri, M., Inada, N., Clocchiatti, A., et al. 2008, AJ, 135, 520 [NASA ADS] [CrossRef] [Google Scholar]
- Okoshi, K., Minowa, Y., Kashikawa, N., et al. 2021, AJ, 162, 175 [NASA ADS] [CrossRef] [Google Scholar]
- Ostrovski, F., McMahon, R. G., Connolly, A. J., et al. 2017, MNRAS, 465, 4325 [Google Scholar]
- Patnaik, A. R., Browne, I. W. A., Walsh, D., Chaffee, F. H., & Foltz, C. B. 1992, MNRAS, 259, 1 [Google Scholar]
- Patnaik, A. R., & Narasimha, D. 2001, MNRAS, 326, 1403 [Google Scholar]
- Phillips, P. M., Norbury, M. A., Koopmans, L. V. E., et al. 2000, MNRAS, 319, L7 [Google Scholar]
- Pindor, B., Eisenstein, D. J., Inada, N., et al. 2004, AJ, 127, 1318 [NASA ADS] [CrossRef] [Google Scholar]
- Pindor, B., Eisenstein, D. J., Gregg, M. D., et al. 2006, AJ, 131, 41 [NASA ADS] [CrossRef] [Google Scholar]
- Pramesh Rao, A., & Subrahmanyan, R. 1988, MNRAS, 231, 229 [NASA ADS] [Google Scholar]
- Queirolo, G., Seitz, S., Riffeser, A., et al. 2023, arXiv e-prints [arXiv:2312.09311] [Google Scholar]
- Ratnatunga, K. U., Ostrander, E. J., Griffiths, R. E., & Im, M. 1995, ApJ, 453, L5 [NASA ADS] [Google Scholar]
- Ratnatunga, K. U., Griffiths, R. E., & Ostrander, E. J. 1999, AJ, 117, 2010 [Google Scholar]
- Reimers, D., Hagen, H. J., Baade, R., Lopez, S., & Tytler, D. 2002, A&A, 382, L26 [NASA ADS] [CrossRef] [EDP Sciences] [Google Scholar]
- Riechers, D. A. 2011, ApJ, 730, 108 [NASA ADS] [CrossRef] [Google Scholar]
- Riello, M., De Angeli, F., Evans, D. W., et al. 2018, A&A, 616, A3 [NASA ADS] [CrossRef] [EDP Sciences] [Google Scholar]
- Rivera, A. B., Morgan, C. W., Florence, S. M., et al. 2024, ApJ, 964, 173 [Google Scholar]
- Rusin, D., Kochanek, C. S., Norbury, M., et al. 2001, ApJ, 557, 594 [NASA ADS] [CrossRef] [Google Scholar]
- Rusu, C. E., Oguri, M., Inada, N., et al. 2011, ApJ, 738, 30 [Google Scholar]
- Rusu, C. E., Oguri, M., Iye, M., et al. 2013, ApJ, 765, 139 [Google Scholar]
- Rusu, C. E., Oguri, M., Minowa, Y., et al. 2016, MNRAS, 458, 2 [Google Scholar]
- Rusu, C. E., Berghea, C. T., Fassnacht, C. D., et al. 2019, MNRAS, 486, 4987 [NASA ADS] [Google Scholar]
- Rusu, C. E., Wong, K. C., Bonvin, V., et al. 2020, MNRAS, 498, 1440 [Google Scholar]
- Saturni, F. G., Trevese, D., Vagnetti, F., Perna, M., & Dadina, M. 2016, A&A, 587, A43 [NASA ADS] [CrossRef] [EDP Sciences] [Google Scholar]
- Schechter, P. L., Gregg, M. D., Becker, R. H., Helfand, D. J., & White, R. L. 1998, AJ, 115, 1371 [NASA ADS] [CrossRef] [Google Scholar]
- Schechter, P. L., Morgan, N. D., Chehade, B., et al. 2017, AJ, 153, 219 [NASA ADS] [CrossRef] [Google Scholar]
- Schechter, P. L., Anguita, T., Morgan, N. D., Read, M., & Shanks, T. 2018, RNAAS, 2, 21 [Google Scholar]
- Schechter, P. L., Sluse, D., Zaborowski, E. A., et al. 2024, arXiv e-prints [arXiv:2404.14256] [Google Scholar]
- Schneider, D. P., Gunn, J. E., Turner, E. L., et al. 1986, AJ, 91, 991 [Google Scholar]
- Scialpi, M., Mannucci, F., Marconcini, C., et al. 2024, A&A, 690, A57 [NASA ADS] [CrossRef] [EDP Sciences] [Google Scholar]
- Shajib, A. J., Birrer, S., Treu, T., et al. 2019, MNRAS, 483, 5649 [Google Scholar]
- Shajib, A. J., Molina, E., Agnello, A., et al. 2021, MNRAS, 503, 1557 [Google Scholar]
- Shalyapin, V. N., & Goicoechea, L. J. 2019, ApJ, 873, 117 [Google Scholar]
- Shalyapin, V. N., Goicoechea, L. J., Koptelova, E., Ullán, A., & Gil-Merino, R. 2008, A&A, 492, 401 [NASA ADS] [CrossRef] [EDP Sciences] [Google Scholar]
- Shalyapin, V. N., Sergeyev, A. V., Goicoechea, L. J., & Zheleznyak, A. P. 2018, MNRAS, 480, 2853 [Google Scholar]
- Shalyapin, V. N., Goicoechea, L. J., & Ruiz-Hinojosa, E. 2025, A&A, 694, A31 [NASA ADS] [CrossRef] [EDP Sciences] [Google Scholar]
- Shu, Y., Marques-Chaves, R., Evans, N.W., & Pérez-Fournon, I. 2018, MNRAS, 481, L136 [Google Scholar]
- Shu, Y., Koposov, S. E., Evans, N. W., et al. 2019, MNRAS, 489, 4741 [Google Scholar]
- Siemiginowska, A., Bechtold, J., Aldcroft, T. L., McLeod, K. K., & Keeton, C. R. 1998, ApJ, 503, 118 [Google Scholar]
- Sluse, D., Surdej, J., Claeskens, J. F., et al. 2003, A&A, 406, L43 [NASA ADS] [CrossRef] [EDP Sciences] [Google Scholar]
- Sluse, D., Chantry, V., Magain, P., Courbin, F., & Meylan, G. 2012, A&A, 538, A99 [NASA ADS] [CrossRef] [EDP Sciences] [Google Scholar]
- Souchay, J., Secrest, N., Lambert, S., et al. 2022, A&A, 660, A16 [NASA ADS] [CrossRef] [EDP Sciences] [Google Scholar]
- Spiniello, C., Agnello, A., Sergeyev, A. V., et al. 2019a, MNRAS, 483, 3888 [Google Scholar]
- Spiniello, C., Sergeyev, A. V., Marchetti, L., et al. 2019b, MNRAS, 485, 5086 [Google Scholar]
- Stern, D., Djorgovski, S. G., Krone-Martins, A., et al. 2021, ApJ, 921, 42 [NASA ADS] [CrossRef] [Google Scholar]
- Surdej, J., Magain, P., Swings, J. P., et al. 1987, Nature, 329, 695 [Google Scholar]
- Surdej, J., Remy, M., Smette, A., et al. 1993, in Liege International Astrophysical Colloquia, 31, eds. J. Surdej, D. Fraipont-Caro, E. Gosset, S. Refsdal, & M. Remy, 153 [Google Scholar]
- Sykes, C. M., Browne, I. W. A., Jackson, N. J., et al. 1998, MNRAS, 301, 310 [NASA ADS] [CrossRef] [Google Scholar]
- Tonry, J. L., & Kochanek, C. S. 1999, AJ, 117, 2034 [CrossRef] [Google Scholar]
- Tonry, J. L., & Kochanek, C. S. 2000, AJ, 119, 1078 [Google Scholar]
- Torra, F., Castañeda, J., Fabricius, C., et al. 2021, A&A, 649, A10 [NASA ADS] [CrossRef] [EDP Sciences] [Google Scholar]
- Treu, T., Suyu, S. H., & Marshall, P. J. 2022, A&A Rev., 30, 8 [Google Scholar]
- Tubín-Arenas, D., Lamer, G., Krumpe, M., et al. 2023, A&A, 672, L9 [NASA ADS] [CrossRef] [EDP Sciences] [Google Scholar]
- Véron-Cetty, M. P., & Véron, P. 2010, A&A, 518, A10 [Google Scholar]
- Walsh, D., Carswell, R. F., & Weymann, R. J. 1979, Nature, 279, 381 [Google Scholar]
- Wang, L., Shu, Y., Li, R., et al. 2017, MNRAS, 468, 3757 [Google Scholar]
- Weymann, R. J., Latham, D., Angel, J. R. P., et al. 1980, Nature, 285, 641 [Google Scholar]
- Wiklind, T., & Combes, F. 1996, Nature, 379, 139 [Google Scholar]
- Williams, L. L. R., & Saha, P. 2004, AJ, 128, 2631 [Google Scholar]
- Williams, P. R., Agnello, A., Treu, T., et al. 2018, MNRAS, 477, L70 [Google Scholar]
- Winn, J. N., Hewitt, J. N., Schechter, P. L., et al. 2000, AJ, 120, 2868 [Google Scholar]
- Winn, J. N., Hewitt, J. N., Patnaik, A. R., et al. 2001, AJ, 121, 1223 [Google Scholar]
- Winn, J. N., Lovell, J. E. J., Chen, H.-W., et al. 2002a, ApJ, 564, 143 [Google Scholar]
- Winn, J. N., Morgan, N. D., Hewitt, J. N., et al. 2002b, AJ, 123, 10 [Google Scholar]
- Wisotzki, L., Koehler, T., Kayser, R., & Reimers, D. 1993, A&A, 278, L15 [NASA ADS] [Google Scholar]
- Wisotzki, L., Koehler, T., Ikonomou, M., & Reimers, D. 1995, A&A, 297, L59 [Google Scholar]
- Wisotzki, L., Koehler, T., Lopez, S., & Reimers, D. 1996, A&A, 315, 405 [Google Scholar]
- Wisotzki, L., Christlieb, N., Liu, M. C., et al. 1999, A&A, 348, L41 [NASA ADS] [Google Scholar]
- Wisotzki, L., Schechter, P. L., Bradt, H. V., Heinmüller, J., & Reimers, D. 2002, A&A, 395, 17 [NASA ADS] [CrossRef] [EDP Sciences] [Google Scholar]
- Wisotzki, L., Schechter, P. L., Chen, H. W., et al. 2004, A&A, 419, L31 [NASA ADS] [CrossRef] [EDP Sciences] [Google Scholar]
- Wong, K. C., Suyu, S. H., Auger, M. W., et al. 2017, MNRAS, 465, 4895 [NASA ADS] [CrossRef] [Google Scholar]
- Wong, K. C., Suyu, S. H., Chen, G. C. F., et al. 2020, MNRAS, 498, 1420 [Google Scholar]
- Wucknitz, O., Wisotzki, L., Lopez, S., & Gregg, M. D. 2003, A&A, 405, 445 [NASA ADS] [CrossRef] [EDP Sciences] [Google Scholar]
- York, T. D. 2005, PhD thesis, University of Manchester, UK [Google Scholar]
- Yue, M., Fan, X., Yang, J., & Wang, F. 2023, AJ, 165, 191 [NASA ADS] [CrossRef] [Google Scholar]
Image with source_id=3511426761399771776 has no valid phot_g_mean_flux in Gaia DR3 such that we assumed phot_g_mean_flux_error=∞. Also, as 2MASSJ13102005-1714579 has two lensing galaxies, dg was not computed for this system.
Appendix A Portion of the catalogue of multiply imaged quasars
Portion of the catalogue of known lenses presenting quadruply imaged quasars fully measured by Gaia DR3 and a selection of properties from the catalogue.
The references we searched for discoveries of lenses are: Agnello et al. (2015, 2018a,b,c); Anguita et al. (2009, 2018); Argo et al. (2003); Augusto et al. (2001); Bade et al. (1997); Beauchemin & Borra (1992); Berghea et al. (2017); Biggs et al. (2003); Blackburne et al. (2008); Browne et al. (1993); Castander et al. (2006); Chan et al. (2022); Chantry et al. (2010); Chavushyan et al. (1997); Chen et al. (2022); Claeskens et al. (1996); Cox et al. (2002); Dahle et al. (2013); Dawes et al. (2023); Delchambre et al. (2019); Desira et al. (2022); Dux et al. (2023, Dux et al. 2024); Eigenbrod et al. (2006b); Fan et al. (2019); Fassnacht & Cohen (1998); Fassnacht et al. (1999); Fischer et al. (1998); Furtak et al. (2023, 2025); Glikman et al. (2023); Goicoechea & Shalyapin (2016); Gross et al. (2023, 2025); Hagen & Reimers (2000); Hawkins (2021); He et al. (2025b,a); Hewitt et al. (1992); Huchra et al. (1985); Inada et al. (2003b,a, 2005, 2006b,a, 2007, 2012, 2014); Irwin et al. (1998); Jackson et al. (1995, 2008, 2012); Jaelani et al. (2021); Jalan et al. (2024); Johnston et al. (2003); Kayo et al. (2010); Kochanek et al. (1997); Koopmans et al. (1999); Kostrzewa-Rutkowska et al. (2018); Krone-Martins et al. (2019, 2018); Lacy et al. (2002); Langston et al. (1989); Lehar et al. (1997); Lemon et al. (2019, 2020, 2018, 2023); Li et al. (2023); Lin et al. (2017); Lubin et al. (2000); Lucey et al. (2018); Magain et al. (1988); Marlow et al. (1999, 2001); Martinez et al. (2023); McKean et al. (2004, 2005); McMahon et al. (1992); More et al. (2016, 2017); Morgan et al. (1999, 2001, 2003a,b); Morokuma et al. (2007); Myers et al. (1995, 1999); Napier et al. (2023); Narasimha et al. (1984); Oguri et al. (2004, 2005); Ostrovski et al. (2017); Patnaik et al. (1992); Phillips et al. (2000); Pindor et al. (2004, 2006); Pramesh Rao & Subrahmanyan (1988); Ratnatunga et al. (1995, 1999); Reimers et al. (2002); Rusu et al. (2016); Schechter et al. (1998, 2017, 2018, 2024); Schmidt et al. (2023); Scialpi et al. (2024); Shajib et al. (2019, 2021); Shalyapin et al. (2018); Shu et al. (2018, 2019); Sluse et al. (2003); Spiniello et al. (2019a,b); Stern et al. (2021); Surdej et al. (1987, 1993); Tubín-Arenas et al. (2023); Walsh et al. (1979); Wang et al. (2017); Weymann et al. (1980); Williams et al. (2018); Winn et al. (2000, Winn et al. 2001, 2002b,a); Wisotzki et al. (1993, Wisotzki et al. 1996, 1999, 2002, 2004); Wucknitz et al. (2003); York (2005); Yue et al. (2023).
The reference we searched for spectroscopic redshifts are: Huchra et al. (1985); Schneider et al. (1986); Wisotzki et al. (1995); Crampton et al. (1996); Fassnacht et al. (1996); Wiklind & Combes (1996); Siemiginowska et al. (1998); Sykes et al. (1998); Fassnacht et al. (1999); Tonry & Kochanek (1999); Lidman et al. (2000); Lubin et al. (2000); Tonry & Kochanek (2000); Winn et al. (2000); Morgan et al. (2001); Rusin et al. (2001); Reimers et al. (2002); Cox et al. (2002); Claeskens & Surdej (2002); Lacy et al. (2002); Morgan et al. (2003b); Biggs et al. (2003); Inada et al. (2003b); McKean et al. (2005); Eigenbrod et al. (2006a,b); Inada et al. (2006a); Ofek et al. (2006); Castander et al. (2006); Inada et al. (2006b); Eigenbrod et al. (2007); Morokuma et al. (2007); Oguri et al. (2008); Anguita et al. (2009); Courbin et al. (2010); Véron-Cetty & Véron (2010); Kayo et al. (2010); McGreer et al. (2010); Riechers (2011); Rusu et al. (2011); Sluse et al. (2012); Inada et al. (2012); Jackson et al. (2012); Rusu et al. (2013); Dahle et al. (2013); Inada et al. (2014); Agnello et al. (2015); More et al. (2016); Schechter et al. (2017); Lin et al. (2017); More et al. (2017); Wang et al. (2017); Gil-Merino et al. (2018); Agnello et al. (2018a,c); Kostrzewa-Rutkowska et al. (2018); Lucey et al. (2018); Williams et al. (2018); Lemon et al. (2018); Anguita et al. (2018); Shu et al. (2018); Schechter et al. (2018); Glikman et al. (2023); Fan et al. (2019); Lemon et al. (2019); Spiniello et al. (2019b); Rusu et al. (2019); Shu et al. (2019); Krone-Martins et al. (2019); Millon et al. (2020a); Lemon et al. (2020); Okoshi et al. (2021); Stern et al. (2021); Jaelani et al. (2021); Hawkins (2021); Chan et al. (2022); Desira et al. (2022); Mozumdar et al. (2023); Tubín-Arenas et al. (2023); Gaia Collaboration (2023a); Dux et al. (2023); Yue et al. (2023); Martinez et al. (2023); Napier et al. (2023); Li et al. (2023); Gross et al. (2023); Dawes et al. (2023); Lemon et al. (2023); Furtak et al. (2023); Flesch (2023); Dux et al. (2024); Fian et al. (2024); Scialpi et al. (2024); Jackson et al. (2024); Keeley et al. (2024); Cloonan et al. (2024); Gross et al. (2024); Acebron et al. (2024); Dux et al. (2025b); He et al. (2025a).
Appendix B Portion of the catalogue of published time delays
Time delays of known gravitational lens systems as collected from the literature.
The references we searched for time delays are: Dux et al. (2025a); Millon et al. (2020b,c); Biggs & Browne (2018); Courbin et al. (2018); Tubín-Arenas et al. (2023); Carnerero et al. (2023); Bekov et al. (2024); Saturni et al. (2016); Hainline et al. (2013); Shalyapin et al. (2025, 2008); Aghamousa & Shafieloo (2017); Muñoz et al. (2022); Fohlmeister et al. (2013); Biggs (2018); Morgan et al. (2008); Bonvin et al. (2018); Eulaers et al. (2013); Goicoechea & Shalyapin (2016); Akhunov et al. (2017); Patnaik & Narasimha (2001); Queirolo et al. (2023); Shalyapin & Goicoechea (2019); Meyer et al. (2023); Eulaers & Magain (2011); Biggs (2021); Fassnacht et al. (2002); Wang et al. (2017); Rivera et al. (2024); Muller et al. (2023); Bonvin et al. (2019); Hawkins (2021); Dahle et al. (2015); Núñez-Pizarro et al. (2026); Burkhonov et al. (2026).
Appendix C Parameters of the SIE+shear lens model for quads with four detections in Gaia DR3
Parameters of the SIE+shear lens model for the 18 quadruply imaged quasars having four lensed images available in Gaia DR3.
Appendix D Finding charts of the quadruply and triply imaged quasars
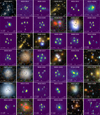 |
Fig. D.1 Finding charts for the 80 known quads and 7 triple systems plotted on top of JWST/F150W (J), HST (H – with subscripted bands H, I, J, Y, wideV), Hyper Suprime-Cam/Subaru (S), Pan-STARRS (P), DESI Legacy Survey DR10 (L), DSS colored (D), Beijing-Arizona Sky Survey (B), CFHT Megacam (CM), or Keck 2 OSIRIS (O). Mean coordinates of the systems are indicated. The Identification of the A, B, C, D components and galaxies usually refers to the discovery publication. "S" stands for systems with only one published component. North is up, east is to the left. |
All Tables
Portion of the catalogue of known lenses presenting quadruply imaged quasars fully measured by Gaia DR3 and a selection of properties from the catalogue.
Time delays of known gravitational lens systems as collected from the literature.
Parameters of the SIE+shear lens model for the 18 quadruply imaged quasars having four lensed images available in Gaia DR3.
All Figures
|
Fig. 1 Number of confirmed lensed quasars discovered per year. The lines correspond to the date of publication of Gaia DR1 (September 2016), DR2 (April 2018), and DR3 (June 2022). |
| In the text | |
|
Fig. 2 All-sky chart in galactic coordinates of the lensed quasars from the catalogue. Quads are indicated with red crosses and doublets with blue dots. This full-sky map uses the Hammer–Aitoff projection in galactic coordinates, with l = b = 0 at the centre, north up, and l increasing from right to left. |
| In the text | |
|
Fig. 3 Distributions of the astrometric and photometric parameters of sources matched with Gaia DR3. parallax_over_error and pm_over_error stand for the parameters divided by their errors. |
| In the text | |
|
Fig. 4 Distribution of the spectroscopic redshifts of quasars and lensing galaxies collected from the literature (number per 0.2 redshift bins). |
| In the text | |
|
Fig. 5 Distributions of the values of time delays (|∆tAB|, |∆tAC|, …) for the known lenses listed in Table B.1. |
| In the text | |
|
Fig. D.1 Finding charts for the 80 known quads and 7 triple systems plotted on top of JWST/F150W (J), HST (H – with subscripted bands H, I, J, Y, wideV), Hyper Suprime-Cam/Subaru (S), Pan-STARRS (P), DESI Legacy Survey DR10 (L), DSS colored (D), Beijing-Arizona Sky Survey (B), CFHT Megacam (CM), or Keck 2 OSIRIS (O). Mean coordinates of the systems are indicated. The Identification of the A, B, C, D components and galaxies usually refers to the discovery publication. "S" stands for systems with only one published component. North is up, east is to the left. |
| In the text | |
Current usage metrics show cumulative count of Article Views (full-text article views including HTML views, PDF and ePub downloads, according to the available data) and Abstracts Views on Vision4Press platform.
Data correspond to usage on the plateform after 2015. The current usage metrics is available 48-96 hours after online publication and is updated daily on week days.
Initial download of the metrics may take a while.