Fig. G.1.
Download original image
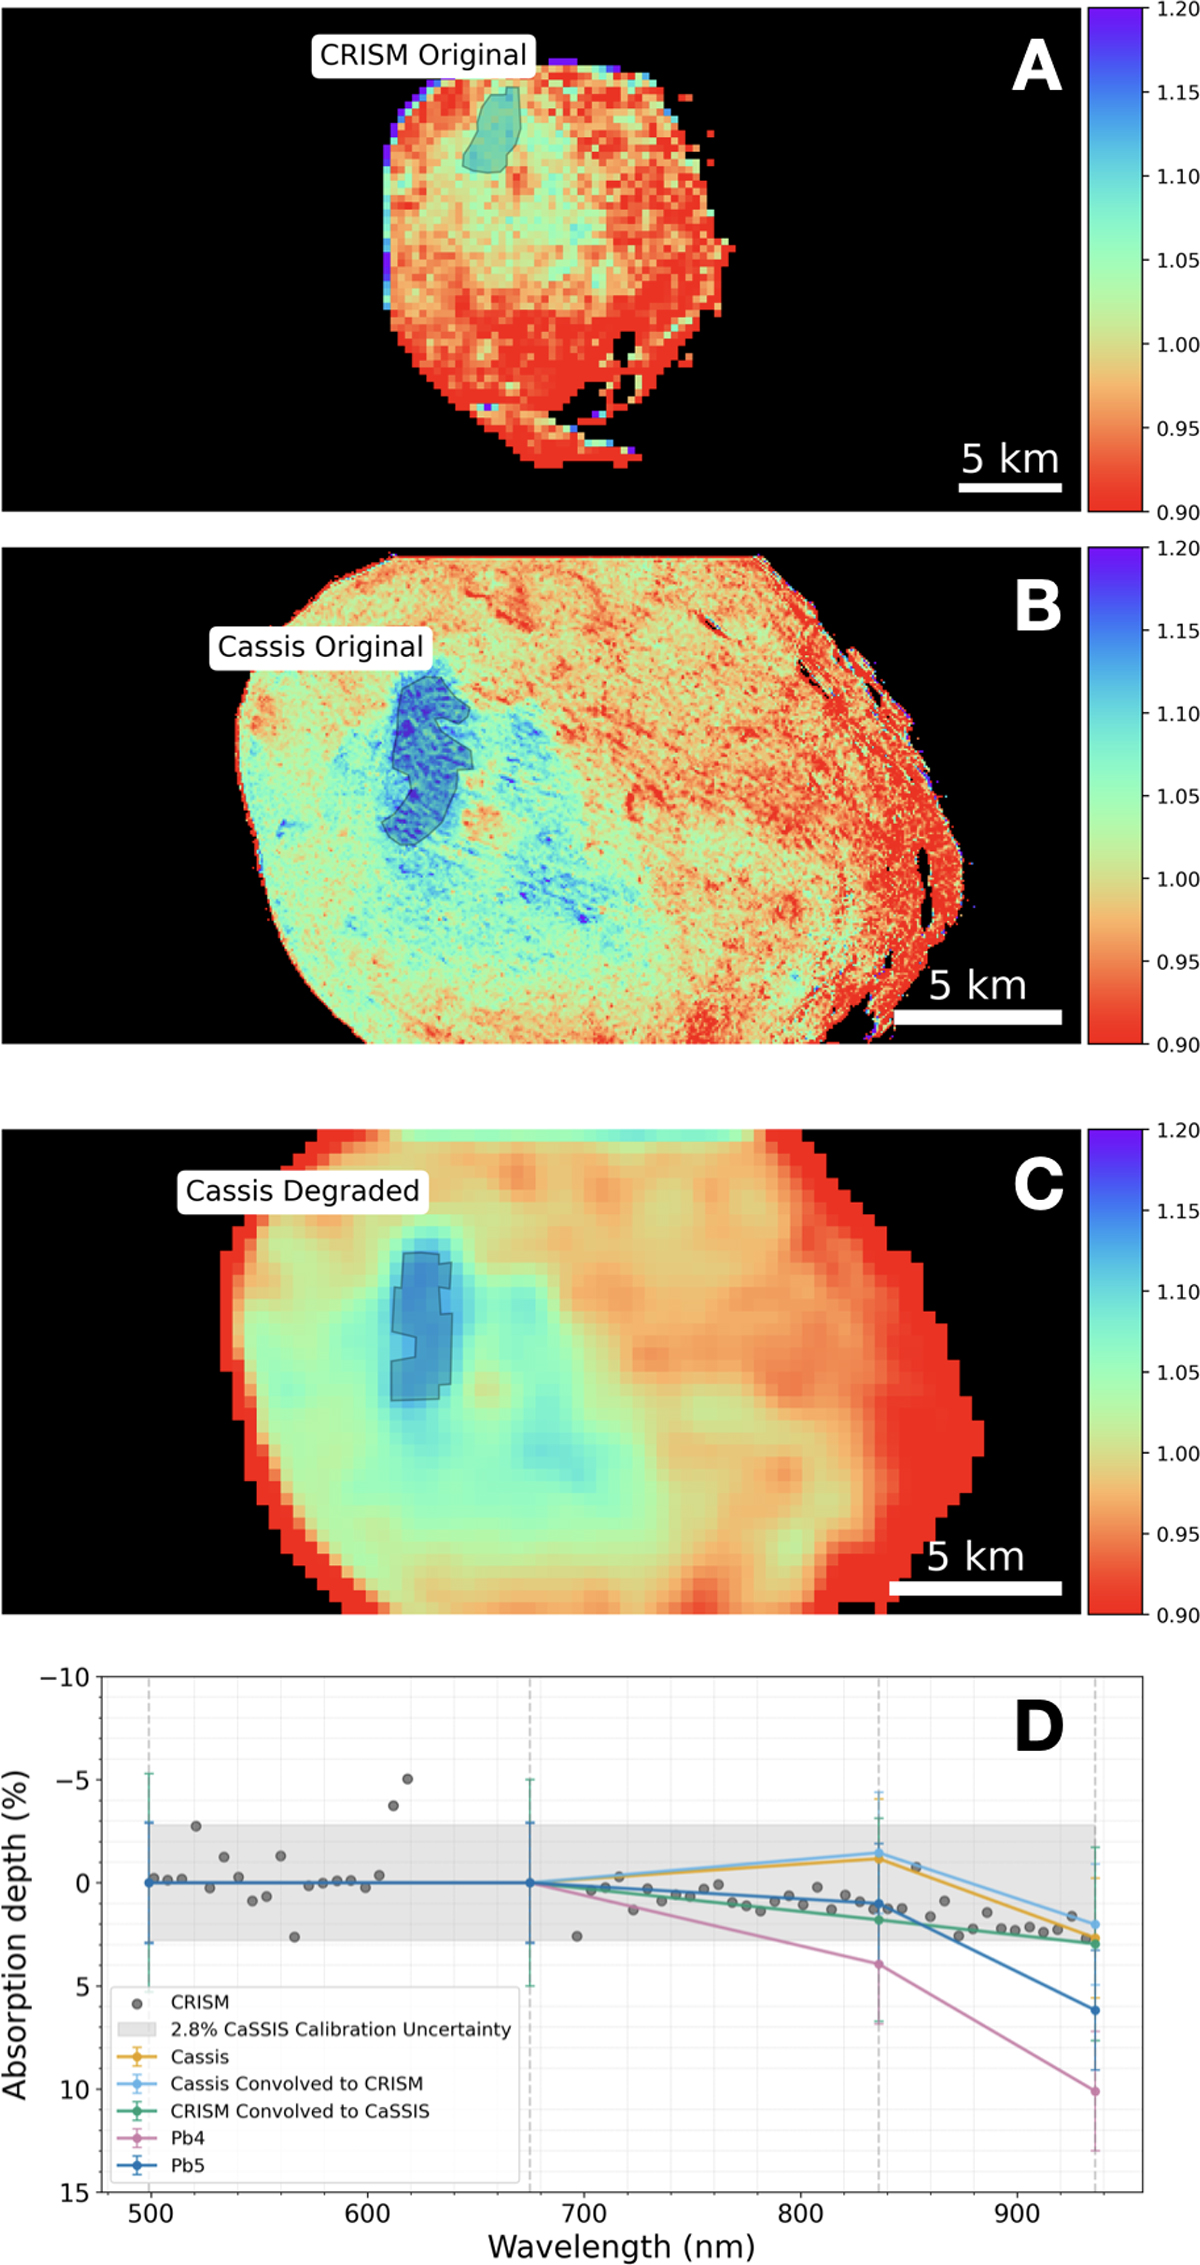
A) ROI identified on the CRISM FRT2992 PAN/NIR computed using as PAN the band at λ= 696 nm and for the NIR the band at λ = 938nm and similar in size to the one used in Fraeman et al. (2014), but optimised to enhance the 1000 nm absorption; B) ROI identified on the original Cassis PAN/NIR; C) ROI identified on the degraded Cassis PAN/NIR; D) Comparison between continuum removed mean spectra extracted from the ROI shown in panels A, B, and C, and panel D. In green, the CRISM spectrum resampled at the CaSSIS filter wavelengths. In black the original CRISM spectrum. In orange, the CaSSIS spectrum extracted from the original dataset. In light blue, the CaSSIS spectrum extracted from the dataset degraded to the CRISM spatial resolution (panel C). In pink and dark blue: CaSSIS spectra from ROIs Pb4 and Pb5.
Current usage metrics show cumulative count of Article Views (full-text article views including HTML views, PDF and ePub downloads, according to the available data) and Abstracts Views on Vision4Press platform.
Data correspond to usage on the plateform after 2015. The current usage metrics is available 48-96 hours after online publication and is updated daily on week days.
Initial download of the metrics may take a while.