Fig. 4.
Download original image
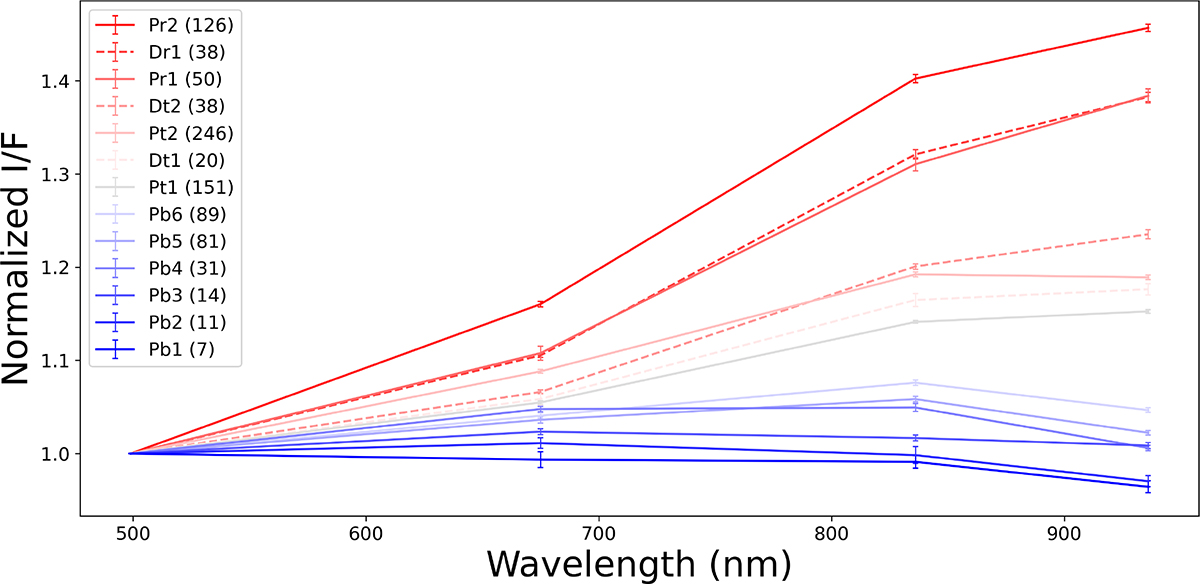
Mean spectra normalised to BLU associated with ROIs in Fig. C.1. The error bars represent 1σ standard errors. The number of pixels of each ROI is reported in the legend. The spectra are labelled as Pbn, Prn, Ptn, and Dbn, where P and D denote Phobos and Deimos; b, r, and t refer to the blue, red, and transitional units; and n indicates the spectrum number.
Current usage metrics show cumulative count of Article Views (full-text article views including HTML views, PDF and ePub downloads, according to the available data) and Abstracts Views on Vision4Press platform.
Data correspond to usage on the plateform after 2015. The current usage metrics is available 48-96 hours after online publication and is updated daily on week days.
Initial download of the metrics may take a while.