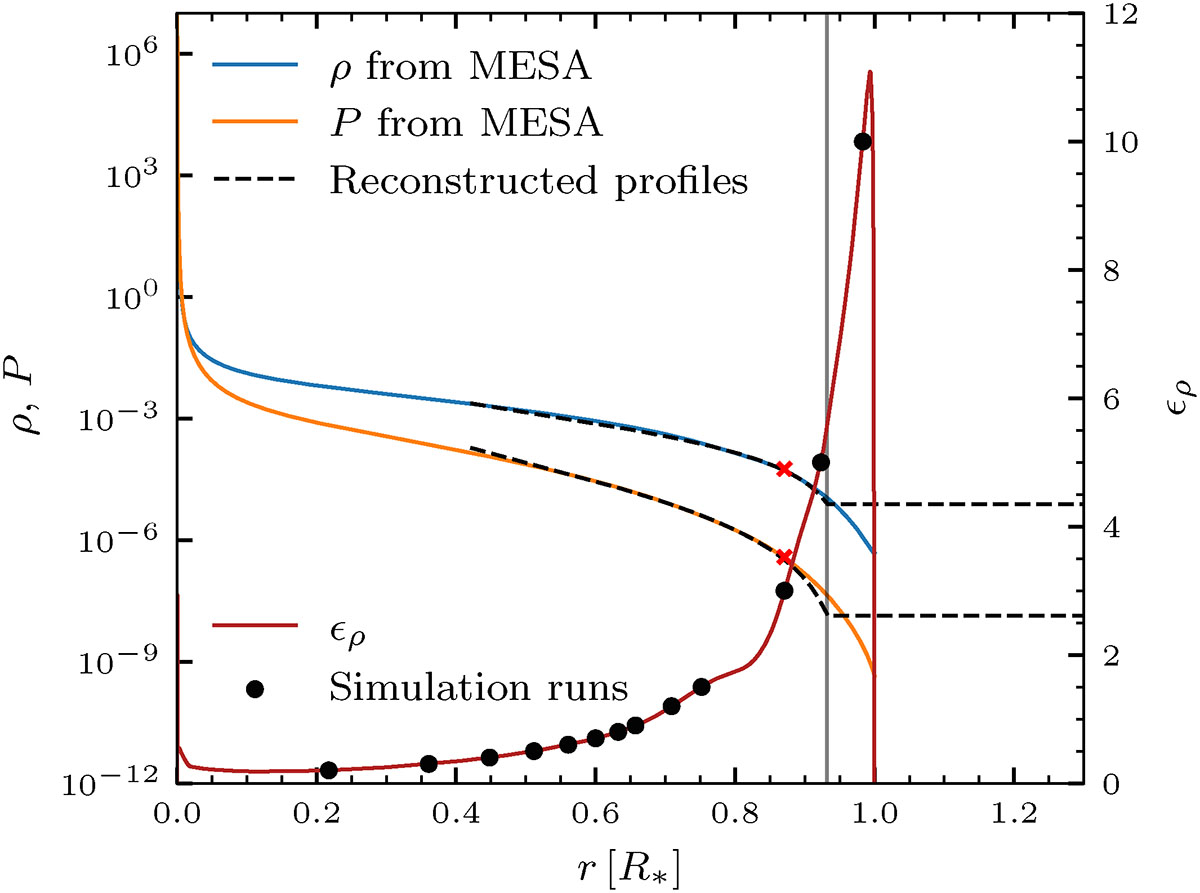
Fig. 1.
Download original image
Density and pressure profiles from the 2 M⊙ red giant MESA model of Ohlmann et al. (2016), shown as a function of the radius. Dashed lines indicate the polytropic reconstruction used as initial conditions, computed around the location where ϵρ = 3, which is marked by red crosses. The vertical line marks the radius where ϵρ = 10 in the reconstructed stellar structure. The red curve shows the stratification parameter (ϵρ) as a function of radius for the MESA model, while black dots indicate the ϵρ values employed in our simulations.
Current usage metrics show cumulative count of Article Views (full-text article views including HTML views, PDF and ePub downloads, according to the available data) and Abstracts Views on Vision4Press platform.
Data correspond to usage on the plateform after 2015. The current usage metrics is available 48-96 hours after online publication and is updated daily on week days.
Initial download of the metrics may take a while.