Fig. B.1.
Download original image
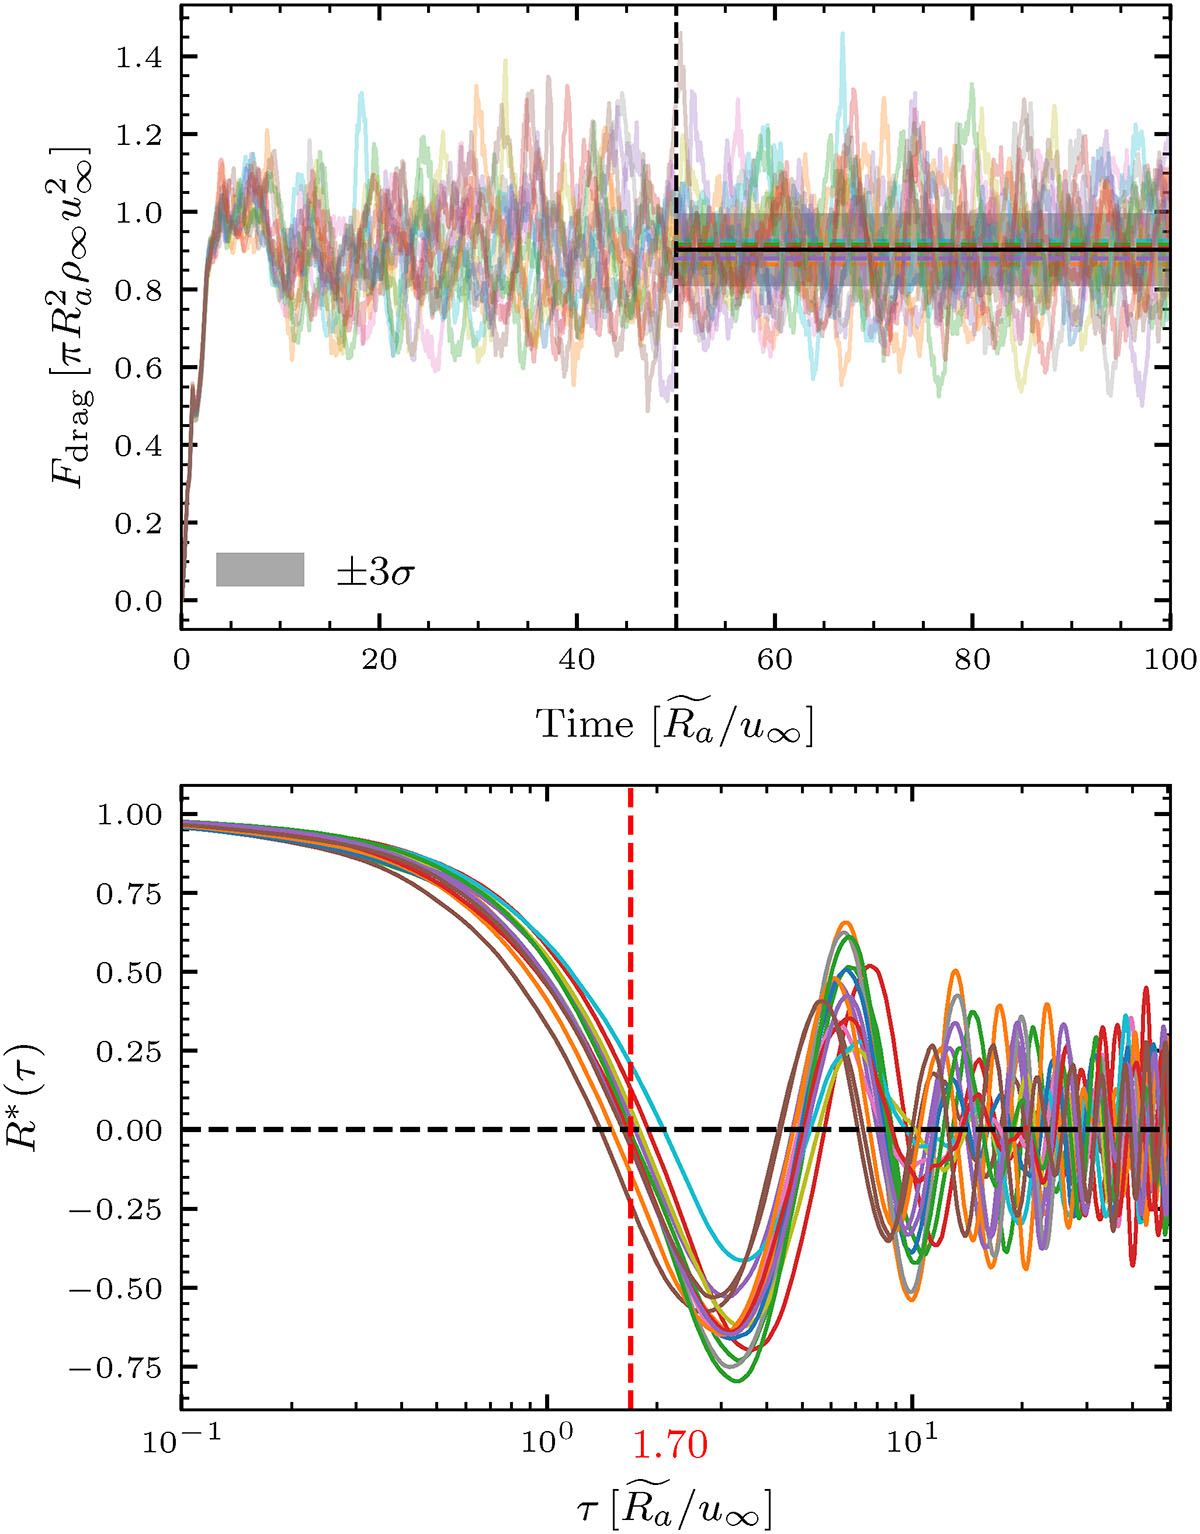
Top: Time evolution of the drag force exerted by the gas on the companion in 15 stratified simulations with ϵρ = 0.5 + δϵρ. Forces are integrated within a sphere of radius ![]() . The shaded region shows the 3σ confidence interval. Bottom: Autocorrelation function of the detrended drag force. The vertical red line marks the mean de-correlation time.
. The shaded region shows the 3σ confidence interval. Bottom: Autocorrelation function of the detrended drag force. The vertical red line marks the mean de-correlation time.
Current usage metrics show cumulative count of Article Views (full-text article views including HTML views, PDF and ePub downloads, according to the available data) and Abstracts Views on Vision4Press platform.
Data correspond to usage on the plateform after 2015. The current usage metrics is available 48-96 hours after online publication and is updated daily on week days.
Initial download of the metrics may take a while.