Fig. 3
Download original image
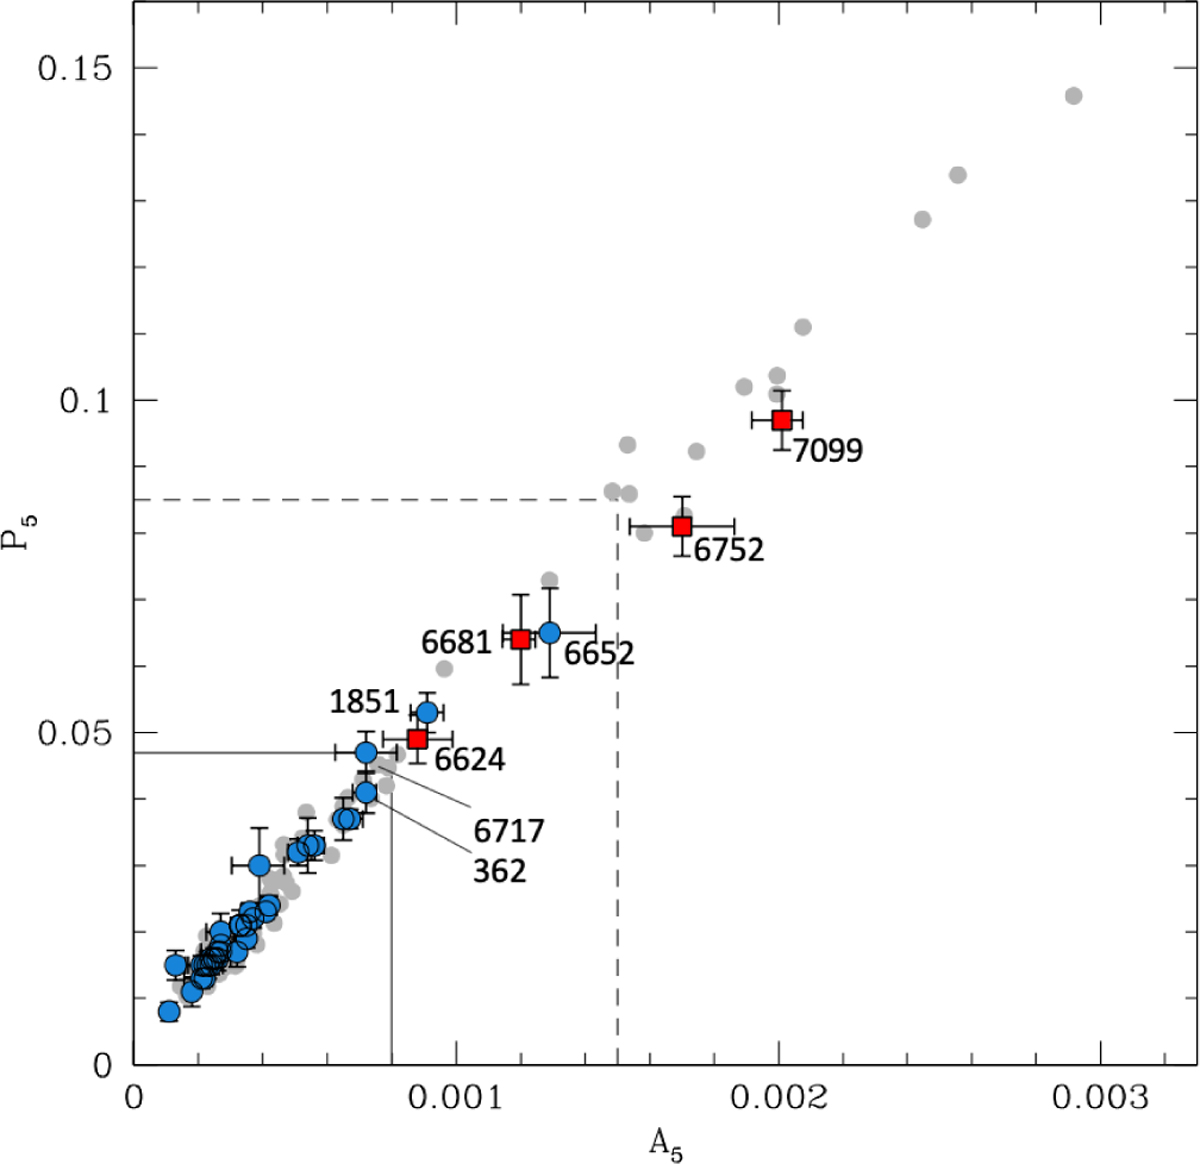
P5 parameter plotted as a function of A5 for the 40 surveyed GCs, with the blue circles referring to pre-CC systems and the red squares marking PCC clusters. The gray circles show the results from the Monte Carlo simulations of B24. The dashed lines mark the limits in A5 and P5 proposed by B24 as boundaries to separate pre-CC from PCC clusters. The solid lines mark the revised limits proposed here.
Current usage metrics show cumulative count of Article Views (full-text article views including HTML views, PDF and ePub downloads, according to the available data) and Abstracts Views on Vision4Press platform.
Data correspond to usage on the plateform after 2015. The current usage metrics is available 48-96 hours after online publication and is updated daily on week days.
Initial download of the metrics may take a while.