| Issue |
A&A
Volume 707, March 2026
|
|
|---|---|---|
| Article Number | A186 | |
| Number of page(s) | 8 | |
| Section | Galactic structure, stellar clusters and populations | |
| DOI | https://doi.org/10.1051/0004-6361/202558092 | |
| Published online | 13 March 2026 | |
New parameters for star-cluster dynamics: Observational results
1
Dipartimento di Fisica e Astronomia, Università degli Studi di Bologna,
Via Gobetti 93/2,
40129
Bologna,
Italy
2
INAF, Osservatorio di Astrofisica e Scienza dello Spazio di Bologna,
Via Gobetti 93/3,
40129
Bologna,
Italy
3
Dept. of Astronomy, Indiana University,
Bloomington,
IN
47401,
USA
★ Corresponding author: This email address is being protected from spambots. You need JavaScript enabled to view it.
Received:
13
November
2025
Accepted:
26
January
2026
Abstract
We recently used a large set of Monte Carlo simulations of globular clusters (GCs) to define new, fully empirical parameters (named A51, P51, and S2.5) able to trace the internal dynamical evolution of dense stellar systems. These parameters are specifically designed to quantify the steepness of the cumulative radial distribution of stars in the innermost region of the host system, which tends to progressively increase with dynamical aging due to core contraction. Following the original definitions, here we measure A51 and P55 in a sample of 40 Galactic GCs homogeneously surveyed through HST photometric observations. In agreement with the predictions of our simulations, the largest values of A55 and P55 are found for the most dynamically evolved GCs - i.e., those previously classified as post-core-collapse systems based on the shape of their density profile - and those characterized by the shortest central relaxation times. Moreover, the new dynamical parameters here measured strongly correlate with A+rh, another fully empirical, independent parameter that traces the dynamical age of star clusters through the level of central segregation of blue straggler stars.
Key words: stars: kinematics and dynamics / globular clusters: general
© The Authors 2026
 Open Access article, published by EDP Sciences, under the terms of the Creative Commons Attribution License (https://creativecommons.org/licenses/by/4.0), which permits unrestricted use, distribution, and reproduction in any medium, provided the original work is properly cited.
This article is published in open access under the Subscribe to Open model. This email address is being protected from spambots. You need JavaScript enabled to view it. to support open access publication.
1 Introduction
In recent years, special attention has been devoted to characterizing the internal dynamical evolution of star clusters. In this respect, globular clusters (GCs) are particularly interesting because they are collisional stellar systems, where two-body interactions among their stars progressively bring the cluster toward a thermodynamically relaxed state on a timescale (the relaxation time) that can be significantly shorter than the cluster age (see, e.g., Meylan & Heggie 1997). Because of such interactions, heavy stars tend to progressively sink toward the central region of the cluster (due to dynamical friction), while low-mass stars migrate outward and are preferentially lost from the system. This yields a progressive contraction of the central regions (particularly of the core radius, rc) and a corresponding increase of the central density (ρ0), until a core-collapse (CC) phase that is eventually halted by the energy provided by primordial or dynamically formed binary stars (see, e.g., Goodman & Hut 1989; McMillan et al. 1990; Gao et al. 1991; Vesperini & Chernoff 1994; Heggie et al. 2006; Trenti et al. 2007). The subsequent post-core-collapse (PCC) phase can be characterized by core oscillations, consisting of several stages during which the cluster rebounds toward a structure with lower density and more extended core, and followed by episodes of core contraction and central density increase (see, e.g., Heggie & Giersz 2009).
The characteristic timescale of such dynamical evolution depends on the cluster’s internal structure and on the interplay between internal dynamical processes and the effects of the host galaxy’s tidal field (see, e.g., Heggie & Hut 2003). This implies that Galactic GCs can be in very different stages of their internal dynamical evolution (i.e., they can have very different “dynamical ages”), in spite of them all being coeval, with formation epochs dating back to ~12-13 Gyr ago (e.g., Ying et al. 2025). The full characterization of any GC therefore requires knowledge not only of its stellar population content, overall structure, and kinematics, but also of its dynamical age.
Unfortunately, it is still very hard to understand from observational properties how far a GC is from CC, or whether it already experienced it and is currently in the gravothermal oscillation phase. The traditional way to pinpoint PCC clusters is to search for a steep central cusp in the surface brightness or projected density distribution, in contrast with the centrally-flat profile commonly observed in non-PCC systems and properly described by King (1966) models. However, this method suffers from both operational drawbacks (i.e., an insufficient angular resolution may prevent the detection of the cusp), and from interpretative uncertainties (i.e., the central cusp is expected to significantly reduce during PCC oscillations). In the last decades, increasing attention has been devoted to searching for parameters able to trace and possibly measure the internal dynamical evolution of star clusters (see, e.g., Baumgardt et al. 2003; Bianchini et al. 2016, 2018; Tiongco et al. 2016; Webb & Vesperini 2017, for methods requiring the determination of the stellar-mass function or internal kinematics at different radial distances from the center). In this context, we followed an approach based on quantities that are relatively easy to measure from observational data. For instance, we used the radial distribution of blue straggler stars (BSSs) within the host cluster. This is a special class of stars that, in the color-magnitude diagram (CMD), appear to be systematically brighter than the cluster main-sequence turn-off (MS-TO); thus, they are easily distinguishable from the other populations. They are thought to be formed through stellar collision, stellar mergers, or mass transfer in binary systems (see, e.g., McCrea 1964; Hills & Day 1976; Sills et al. 2005; Perets & Fabrycky 2009), which make them more massive than normal cluster stars, with values of ~1.2 M⊙ in Galactic GCs (e.g., Shara et al. 1997; Gilliland et al. 1998; Fiorentino et al. 2014; Raso et al. 2019; see also Geller & Mathieu 2012 for results in open clusters). Indeed, signatures of the BSS anomalous formation processes have been detected in their observational properties, such as peculiar rotational velocities (e.g., Lovisi et al. 2010, 2012; Ferraro et al. 2023a; Mathieu & Geller 2009; Billi et al. 2023, 2024), anomalies in their surface chemical abundances (Ferraro et al. 2006; Lovisi et al. 2013), UV-excess in their spectral energy distributions (e.g., Gosnell et al. 2014, 2015; Reggiani et al. 2025), and atypical specific frequencies (Knigge et al. 2009; Ferraro et al. 2026). Because of their relatively high mass and their ubiquity, BSSs can be used as effective gravitational test particles: their radial distribution and their level of segregation toward the cluster center have been found to be powerful indicators of internal dynamical evolution (Ferraro et al. 2012, 2020), with the exciting possibility that their photometric properties also keep a record of the CC event (Ferraro et al. 2009; Dalessandro et al. 2013; Beccari et al. 2019; Portegies Zwart 2019; Cadelano et al. 2022). In particular, the level of BSS central segregation was quantified through the A+rh parameter, which is defined as the area between the cumulative radial distribution of BSSs and that of a lighter reference population measured out to the half-mass radius rh (Alessandrini et al. 2016; Lanzoni et al. 2016). As expected for an efficient indicator of internal dynamics, the A+rh parameter shows a strong positive correlation with the number of central relaxation times suffered by the host cluster since formation, both in the Galaxy (Ferraro et al. 2018, 2023b) and in the Magellanic Clouds (Ferraro et al. 2019; Dresbach et al. 2022; Giusti et al. 2024, 2025). More recently, we explored the possibility of using the entire stellar population, in place of the BSSs only, to trace the host cluster’s dynamical evolution. By using a large set of MOCCA (e.g., Giersz et al. 2013) Monte Carlo simulations of GCs run from different initial conditions, we found (Bhat et al. 2022, 2023, 2024) that the level of internal dynamical evolution of the host system is quantified by three parameters named A5, P5, and S2.5, which trace the shape of the normalized cumulative radial distribution (nCRD) of cluster stars (see Section 2). The present work focused on measuring A5 and P5 in a sample of 40 Galactic GCs surveyed with HST photometry to verify the effectiveness of this new method in the determination of the level of internal dynamical evolution from observational data.
2 Definition of the nCRD parameters
The nCRD parameters A5, P5, and S2.5 were originally defined in Bhat et al. (2022) and further discussed in Bhat et al. (2023, 2024). They are specifically designed to quantify the morphology of the nCRD traced by the cluster’s stellar population in the inner region of the host system. All the details can be found in those papers, but we briefly summarize the main characteristics here.
The population used to build the nCRDs in Bhat et al. (2022, 2023, 2024) includes all the stars brighter than Vcut = VMS-TO + 0.5 (with VMS-TO being the magnitude of the MS-TO in the V band) and located within a projected distance, Rcut = 0.5 × rh, of the cluster center. This turned out to be the best compromise between the need to maximize the morphological differences among the nCRDs of clusters that reached different stages of internal dynamical evolution and providing large enough statistics. By construction, in each cluster the nCRD is a monotonically increasing curve ranging between 0 in the center, and 1 at R/rh = 0.5. The steeper it is, the higher the concentration of the surveyed stars in innermost regions. To quantify the nCRD steepness, we defined the following three parameters (see also Figure 6 in Bhat et al. 2022 for a graphical representation):
A5 is the area subtended by the nCRD within the innermost 5% of the half-mass radius (i.e., out to R/rh = 0.05).
P5 is the value of the nCRD (i.e., the fraction of stars) at the same distance from the center.
S2.5 is the slope of the tangent to the nCRD at R/rh = 0.025, which is determined as the straight-line tangent to the third-order polynomial function best fitting the nCRD.
By definition, the higher the concentration of stars within 0.05 × rh (for A5 and P5) or within 0.025 × rh (for S2.5), the steeper the nCRD and the larger the value of the corresponding nCRD parameter. Since internal dynamical evolution leads to a progressive contraction of the core and therefore tends to increase the central density, steeper nCRDs are expected in the innermost regions of CC and PCC clusters, with respect to less dynamically evolved systems. Indeed, from the analysis of almost 100 simulated GCs, we find increasingly large values of the nCRD parameters for increasingly more dynamically evolved systems, thus demonstrating that these are powerful tracers of internal dynamical evolution (see Bhat et al. 2024, hereafter B24). As detailed in B24, the adopted Monte Carlo simulations were run assuming different initial masses (number of particles), concentrations, galactocentric distances, binary fractions, black-hole retention fractions, and tidal filling factors (see Table 1 in B24), and all GCs were analyzed after 13 Gyr of evolution. The values of their King concentration parameters, core radii, half-mass radii, and central relaxation times are in very good agreement with those observed in the Milky Way (see Fig. 3 in B24), demonstrating that they are well representative of the Galactic GC population.
3 Measuring the nCRD parameters in observational data
Because of the definitions above, the measure of the nCRD parameters in real GCs requires high-resolution photometric observations with an adequate level of completeness to guarantee the appropriate exploration of the central regions even in high-density systems. For this reason, we took advantage of the data secured in the HST UV Legacy Survey of Galactic GCs, providing WFC3/UVIS photometry in the F275W and F336W filters for more than 50 Milky Way GCs (see Piotto et al. 2015). As discussed in many previous papers (e.g., Ferraro et al. 1997, 2001, 2003; Raso et al. 2017), UV-band observations are particularly effective for the exploration of the innermost regions of high-density, old star clusters, because red giant stars, which dominate the emission in the optical bands, are faint at these wavelengths. This significantly reduces the problems due to photometric blends and crowding, resulting in completeness levels above 70-80% in the MS-TO region even for the most crowded clusters, as demonstrated by the artificial star experiments discussed in Ferraro et al. (2018).
Such a large sample of data all acquired in the same photometric bands also offers the opportunity to perform a homogeneous selection of the cluster stellar populations needed to build the nCRDs. As discussed above (Section 2), in the analysis of the simulated clusters we considered all the stars brighter than 0.5 magnitudes below the MS-TO level in the V band. This choice was driven by the fact that reaching fainter optical magnitudes in the innermost regions of high-density clusters is typically very hard, even with HST data (see, e.g., Raso et al. 2019). However, Bhat et al. (2022) also discussed the effect of adopting a fainter cut (Vcut = VMS-TO + 2) to increase the statistics of the considered sample. The authors found that, in spite of a slightly reduced sensitivity (due to the inclusion of stars with lower masses, which are less affected by the dynamical processes occurring in the cluster center), the overall trend of the nCRD parameters with dynamical evolution remains unchanged (see their Fig. 9). In the present study we used UV magnitudes (in place of optical ones) and we selected all the stars that are brighter than one magnitude (in place of 0.5 magnitudes) below the MS-TO in the F275W filter, thus achieving larger statistics. From the analysis of BaSTI isochrones (Pietrinferni et al. 2013), we found that adopting a cut at one magnitude below the MS-TO results in the inclusions of stars that are just 0.02 M⊙ less massive than those corresponding to a 0.5 magnitude cut, independently of the cluster metallicity. Hence, when also considering the findings of Bhat et al. (2022) discussed above, we expect that the different choices adopted here have a negligible effect on the results, meaning the capacity of the nCRD parameters to efficiently trace dynamical evolution remains high.
To guarantee homogeneity among the surveyed clusters, avoiding the combination of datasets acquired in different photometric bands and with different instruments, we excluded all the systems where the region included within Rcut = 0.5 × rh is not entirely sampled by the WFC3/UVIS field of view (~162″ × 162″). The adopted values of rh were taken from the Harris (1996) compilation or determined in previous works from the King (1966) models that best fit the observed density profiles (see Miocchi et al. 2013; Lanzoni et al. 2016; Ferraro et al. 2018, 2026). The only exceptions are NGC 6624, NGC 6681, and NGC 7099 (M30), three PCC clusters for which the King concentration was arbitrarily fixed at c = 2.5 in the Harris (1996) catalog, because the presence of a central density cusp prevents the model from properly fitting the observations. Here, we used the WFC3/UVIS data combined with Stetson et al. (2019) catalogs to redetermine the projected density profile of these three clusters from resolved star counts (see, e.g., Miocchi et al. 2013 for the details about the adopted method) and, following the prescriptions of Bhat et al. (2022), we searched for the King model that best reproduces the entire density distribution, without (arbitrarily) excluding the central cuspy portion of the profile. The results are shown in Figure 1. Although the fits are not optimal (as expected and already observed in all PCC clusters), they are reasonably accurate1, and we therefore adopted the half-mass radii obtained from this procedure. Table A.1 lists the values of rh adopted for the 40 GCs analyzed in this work.
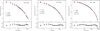 |
Fig. 1 Projected density profile corrected for Galactic-field contamination (black circles) for the PCC clusters NGC 6624, NGC 6681, and NGC 7099 (left, central, and right panels, respectively). In each case, the values of the best-fit King (1966) model parameters are labeled, and the bottom panel shows the residuals between the model and the observations. |
4 Results
The nCRDs traced by the stars brighter than one magnitude below the MS-TO in the F275W filter, and included within a projected distance of 0.5 × rh from the center of the 40 studied clusters, are shown as thick colored lines in Figure 2. The comparison with the region occupied by nCRDs of the simulated clusters (shaded gray area, from B24) shows a very good agreement. In addition, we find that the nCRDs of the clusters classified as PCC systems in the Harris (1996) compilation (red lines) are centrally steeper than the others. This is also in agreement with the theoretical results of B24, and it attests a higher concentration of stars in the innermost cluster regions due to the more advanced dynamical stages. Interestingly, the nCRDs of NGC 1851 and NGC 6652 (see labels) show central steepness comparable to those of NGC 6681 and NGC 6624, which are classified as PCC clusters.
Following the definitions discussed in Sect. 2, we measured the values of A5 and P5 from each observed nCRD. We did not attempt to determine the S2.5 parameter because several clusters have too few stars observed within 0.025 × rh from the center (i.e., fewer than 30 stars are counted in half of the GC sample), which prevents a reliable determination of the slope of the nCRD. On the other hand, S2.5 shows the same behavior with dynamical evolution as the other two parameters (see B24). We estimated the uncertainty associated with A5 and P5 (εA5 and εP5, respectively) by taking into account the uncertainty on the halfmass radius (see Bhat et al. 2022) and that on the position of the cluster center. Unfortunately, the error on rh is not always known (e.g., in the Harris catalog), and we therefore adopted an uncertainty of 5% for all the values of rh, since this is the typical value found in the available cases. Then, we built the nCRDs adopting radial cuts of Rcut,err = 0.5 × (rh ± 5%rh), and we measured the values of the A5 and P5 parameters from these nCRDs. The uncertainties were calculated as the absolute differences between the value of A5 obtained by adopting Rcut and those obtained by assuming Rcut,err for every cluster, and analogously for P5. Miscentering is another potential source of error because the nCRDs change shape if they are built with respect to different positions within the cluster. To estimate this contribution, we adopted the published uncertainties on the center coordinates, if available, or we assumed 0.5″ as a conservative error. Then, we built the nCRDs with respect to four different positions obtained by offsetting the center to the north, east, south, and west by an amount equal to the assumed error. The average absolute difference between the values of A5 (and P5) obtained from each direction and that computed with respect to the right center was finally adopted as the miscentering contribution. The final error on the two parameters (A5 and P5) was computed by summing the respective contribution from the uncertainty on rh and that from the miscentering in quadrature. The obtained values are listed in Table A.1.
Figure 3 shows P5 as a function of A5. The observed values (red and blue symbols) are very well superposed to those measured in the simulated clusters (gray circles), closely following the same monotonically increasing trend. As in the simulations, most of the observed GCs are located in the bottom left corner of the plot, corresponding to poorly dynamically evolved systems, while the PCC clusters (red squares) are found at systematically larger values of A5 and P52. The largest values measured in the simulations (A5 > 0.002 and P5 > 0.1) are never attained by the observed clusters. As already anticipated by the shape of the nCRDs, NGC 6652 and NGC 1851 have values of A5 and P5 that are very close to those of the PCC systems NGC 6681 and NGC 6624, respectively. The dashed lines in Fig. 3 mark the boundaries of the region that B24 proposed as separation between pre- and post-CC systems. Based on the observational results, we revised these boundaries, suggesting that the clusters that already experienced the CC phase are characterized by A5 > 0.008 and P5 > 0.47. Interestingly, two GCs that are suspected to be PCC systems (namely NGC 362 and NGC 6717; see Dalessandro et al. 2013 and Ortolani et al. 1999, respectively) are located very close to these new boundaries.
In Figure 4, we study the dependence of A5 on the concentration parameter (c) of the King models that best fit the projected density profiles. As expected, A5 systematically increases with c, attesting a higher central segregation of stars in more dynamically evolved systems. However, we notice a disagreement between the observations (colored symbols) and the simulations (gray circles) for c > 1.8; the observed values of A5 are systematically smaller than those measured in the simulated clusters for any fixed value of c, or the observed King concentration is systematically larger than that found in the simulations for fixed A5 (with the only exception being NGC 6652). In addition, while the values of A5 measured in the simulated clusters (gray circles) are systematically larger than those obtained from the direct integration of the King models with the same concentration c (solid line), this is no longer the case for the observational data. This once more demonstrates the difficulty in and the limits to describing dynamically evolved GCs using King models, and it indicates that the dependence of A5 on c cannot be efficiently used to pinpoint PCC systems.
Figure 5 shows A5 and P5 as a function of the central relaxation time (trc) computed by using Equation (7) of Djorgovski (1993) and listed in Table A.1. The well-defined anticorrelations between these parameters once more confirms that A5 and P5 are powerful indicators of dynamical evolution.
Finally, we compared the values of A5 and P5 with those of the A+rh parameter, which measures the segregation of BSSs toward the center of each system with respect to a reference population of lighter stars (see Alessandrini et al. 2016). To measure this parameter for Galactic GCs, Ferraro et al. (2018) analyzed the same observational data used in this paper, acquired through the HST UV Survey of Galactic GCs (Piotto et al. 2015). However, the measurement of A+rh requires a radial sampling of each system out to rh (while the radial cut adopted to determine A5 and P5 is half this value). Hence, seven GCs in the sample studied here have no value of A+rh in Ferraro et al. (2018), while the remaining 33 are in common between the two works. Figure 6 shows the logarithm of A5 and P5 as a function of A+rh (left and right panels, respectively). In both diagrams, we find a strong positive correlation, with the most dynamically evolved GCs having the largest values of A5, P5, and A+rh. Interestingly, NGC 362 is close to the boundaries between pre-CC and PCC systems adopted in this work (solid line) and, independently, in Ferraro et al. (2023b, dotted line, corresponding to A+rh = 0.3), which likely suggests once more that it is close to CC.
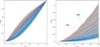 |
Fig. 2 Observed nCRDs of the 40 GCs analyzed in this work. The red lines refer to the four PCC systems in the sample, and the blue lines refer to the other GCs. The right panel shows a zoomed-in view of the innermost region (out to 0.05 × rh), where the nCRD parameters are measured. In both panels, the gray shaded areas correspond to the region occupied by the nCRDs of the B24 simulated clusters. |
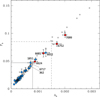 |
Fig. 3 P5 parameter plotted as a function of A5 for the 40 surveyed GCs, with the blue circles referring to pre-CC systems and the red squares marking PCC clusters. The gray circles show the results from the Monte Carlo simulations of B24. The dashed lines mark the limits in A5 and P5 proposed by B24 as boundaries to separate pre-CC from PCC clusters. The solid lines mark the revised limits proposed here. |
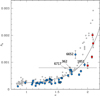 |
Fig. 4 A5 parameter as a function of the best-fit King model concentration c for the observed clusters (colored symbols, as in Fig. 3) and for the B24 simulations (gray circles). The solid horizontal line marks the proposed A5 boundary separating pre-CC from PCC systems. The thick black curve traces the values of A5 calculated from the integration of King density profiles of varying concentration parameters, c. |
5 Summary and conclusions
In a series of previous papers (Bhat et al. 2022, 2023, 2024), we used a suite of dedicated Monte Carlo simulations to define the nCRD parameters A5 and P5 (see Sect. 2) and demonstrate their ability to trace the level of internal dynamical evolution experienced by GCs. In this work, we determined A5 and P5 from observational data acquired with HST photometry (Piotto et al. 2015) for a sample of 40 Galactic GCs.
Figures 3 and 5 demonstrate an excellent agreement between observations and simulations. In addition, both parameters show a well-defined anticorrelation with the central relaxation time. These results strongly confirm that A5 and P5 are powerful diagnostics of dynamical evolution. From the observed position of the PCC clusters in the A5 - P5 diagram (red squares in Fig. 3), we revise the location of the boundaries separating pre-CC from PCC systems with respect to those originally proposed by B24 (dashed lines in Fig. 3); the comparison with observational data suggests A5 > 0.008 and P5 > 0.47 (solid lines in the same figure). However, these should only be considered as reference values since CC is not expected to be an instantaneous phenomenon, and a smooth transition between the pre- and post-CC states is therefore expected, with a number of clusters being on the verge of starting CC, or currently experiencing it. In fact, NGC 6717 and NGC 362, which are suspected to be close to reaching CC (Ortolani et al. 1999; Dalessandro et al. 2013), are just below these limits and may indicate the existence of a “gray region” of transition between the two states. The comparison shown in Fig. 4 indicates that higher central concentration systems have larger values of A5 , in agreement with the expectations from an effect of internal dynamical evolution.
The remarkable agreement between observations and simulations in the A5 - trc diagram (Fig. 5) allowed us to tentatively identify the GCs that more likely host an intermediate-mass black hole (IMBH) or a large number of stellar-mass BHs. In fact, from the Monte Carlo simulation analysis, B24 noticed that in the A5-trc diagram, the systems including a central IMBH are all clumped at -3.35 < log(A5) < -3.0 and log(trc) ~ 7.6 (see the gray symbols encircled in green in Fig. 5), and the clusters hosting more than 30 stellar-mass BHs tend to populate the bottom right corner of the distribution (see the gray symbols encircled in orange). As labeled in Fig. 5, a few of the Galactic GCs studied in this work occupy the locus of the A5 - trc and P5 - trc planes populated by models containing either an IMBH or more than 30 stellar-mass BHs. Although these portions of the A5 - trc and P5 - trc planes are also populated by models with no IMBH and no stellar-mass BHs, the identification of GCs with these values of A5, P5, and trc may guide further investigations needed to confirm or rule out the presence of the suspected BHs (based, e.g., on the study of GC internal kinematics; see, e.g., Della Croce et al. 2024). Thus, in principle, this diagram provides a useful tool to select potentially interesting clusters, with specific investigations then needed to confirm or exclude the presence of the suspected BHs.
Figure 6 shows that A5 and P5 strongly correlate also with the A+rh parameter, which traces GC dynamical evolution through the level of central segregation of their BSS populations (Ferraro et al. 2018). This further demonstrate the potential of these parameters as diagnostics of internal dynamics. Since each approach is affected by operational difficulties and uncertainties (as any other method proposed in the literature; e.g., Baumgardt et al. 2003; Bianchini et al. 2016, 2018; Tiongco et al. 2016; Webb & Vesperini 2017), the possibility of using more than one parameter is of great advantage. For instance, A5 and P5 could be particularly useful in clusters with very small populations of BSSs, or where the CMD region of BSSs is strongly contaminated by the host galaxy’s field stars. The main limitation of the nCRD parameter approach is the need for high-resolution, homogeneous, and complete photometry down to below the MS-TO, from the very center out to 0.5 × rh, in both extended and very concentrated GCs. In addition, determining rh in PCC clusters, where the density profile is not well reproduced by flat-core King models, is not straightforward. Hence, the method would also benefit from a redefinition of the radial cut used to build the nCRDs (Rcut), avoiding the need to use King model fitting.
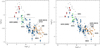 |
Fig. 5 A5 and P5, parameters (right and left panels, respectively) as a function of the central relaxation time, in logarithmic units. The meaning of the symbols and horizontal line is the same as in Fig. 4. The gray symbols encircled in green and orange correspond, respectively, to the simulated clusters that, at an age of 13 Gyr, host a central IMBH (green) and at least 30 stellar-mass BHs (orange). |
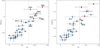 |
Fig. 6 Logarithm of A5 and P5 as a function of the A+rh parameter (left and right panels, respectively). The solid and dashed lines mark, respectively, the boundaries between pre-CC and PCC systems as proposed in the present work (A5 > 0.008, P5 > 0.47) and in Ferraro et al. (2023b, A+rh = 0.3). |
Acknowledgements
This work is part of the project “GENESIS - Searching for the primordial structures of the Universe in the heart of the Galaxy” (Advanced Grant FIS-2024-02056, PI:Ferraro), funded by the Italian MUR through the Fondo Italiano per la Scienza (FIS) call.
References
- Alessandrini, E., Lanzoni, B., Ferraro, F. R., et al. 2016, ApJ, 833, 252 [NASA ADS] [CrossRef] [Google Scholar]
- Baumgardt, H., & Hilker, M. 2018, MNRAS, 478, 1520 [Google Scholar]
- Baumgardt, H., Heggie, D. C., Hut, P., et al. 2003, MNRAS, 341, 247 [NASA ADS] [CrossRef] [Google Scholar]
- Beccari, G., Ferraro, F. R., Dalessandro, E., et al. 2019, ApJ, 876, 87 [NASA ADS] [CrossRef] [Google Scholar]
- Bhat, B., Lanzoni, B., Ferraro, F. R., et al. 2022, ApJ, 926, 118 [NASA ADS] [CrossRef] [Google Scholar]
- Bhat, B., Lanzoni, B., Ferraro, F. R., et al. 2023, ApJ, 945, 164 [Google Scholar]
- Bhat, B., Lanzoni, B., Vesperini, E., et al. 2024, ApJ, 968, 2 [NASA ADS] [CrossRef] [Google Scholar]
- Bianchini, P., van de Ven, G., Norris, M. A., et al. 2016, MNRAS, 458, 3644 [NASA ADS] [CrossRef] [Google Scholar]
- Bianchini, P., Webb, J. J., Sills, A., et al. 2018, MNRAS, 475, L96 [Google Scholar]
- Billi, A., Ferraro, F. R., Mucciarelli, A., et al. 2023, ApJ, 956, 124 [NASA ADS] [CrossRef] [Google Scholar]
- Billi, A., Ferraro, F. R., Mucciarelli, A., et al. 2024, A&A, 690, A156 [NASA ADS] [CrossRef] [EDP Sciences] [Google Scholar]
- Cadelano, M., Dalessandro, E., Ferraro, F. R., et al. 2017, ApJ, 836, 170 [NASA ADS] [CrossRef] [Google Scholar]
- Cadelano, M., Ferraro, F. R., Dalessandro, E., et al. 2022, ApJ, 941, 69 [CrossRef] [Google Scholar]
- Dalessandro, E., Ferraro, F. R., Massari, D., et al. 2013, ApJ, 778, 13 [Google Scholar]
- Della Croce, A., Aros, F. I., Vesperini, E., et al. 2024, A&A, 690, A17 [Google Scholar]
- Djorgovski, S. 1993, Struct. Dyn. Globular Clusters, 50, 373 [Google Scholar]
- Dresbach, F., Massari, D., Lanzoni, B., et al. 2022, ApJ, 928, 47 [NASA ADS] [CrossRef] [Google Scholar]
- Ferraro, F. R., Paltrinieri, B., Fusi Pecci, F., et al. 1997, ApJ, 484, L145 [Google Scholar]
- Ferraro, F. R., D’Amico, N., Possenti, A., et al. 2001, ApJ, 561, 337 [NASA ADS] [CrossRef] [Google Scholar]
- Ferraro, F. R., Sills, A., Rood, R. T., et al. 2003, ApJ, 588, 464 [NASA ADS] [CrossRef] [Google Scholar]
- Ferraro, F. R., Sabbi, E., Gratton, R., et al. 2006, ApJ, 647, L53 [NASA ADS] [CrossRef] [Google Scholar]
- Ferraro, F. R., Beccari, G., Dalessandro, E., et al. 2009, Nature, 462, 1028 [NASA ADS] [CrossRef] [Google Scholar]
- Ferraro, F. R., Lanzoni, B., Dalessandro, E., et al. 2012, Nature, 492, 39 [Google Scholar]
- Ferraro, F. R., Lanzoni, B., Raso, S., et al. 2018, ApJ, 860, 36 [NASA ADS] [CrossRef] [Google Scholar]
- Ferraro, F. R., Lanzoni, B., Dalessandro, E., et al. 2019, Nat. Astron., 3, 1149 [NASA ADS] [CrossRef] [Google Scholar]
- Ferraro, F. R., Lanzoni, B., & Dalessandro, E. 2020, Rend. Lincei. Sci. Fis. Nat., 31, 19 [Google Scholar]
- Ferraro, F. R., Mucciarelli, A., Lanzoni, B., et al. 2023a, Nat. Commun., 14, 2584 [NASA ADS] [CrossRef] [Google Scholar]
- Ferraro, F. R., Lanzoni, B., Vesperini, E., et al. 2023b, ApJ, 950, 145 [NASA ADS] [CrossRef] [Google Scholar]
- Ferraro, F. R., Lanzoni, B., Vesperini, E., et al. 2026, Nat. Commun., 17, 768 [Google Scholar]
- Fiorentino, G., Lanzoni, B., Dalessandro, E., et al. 2014, ApJ, 783, 34 [NASA ADS] [CrossRef] [Google Scholar]
- Gao, B., Goodman, J., Cohn, H., et al. 1991, ApJ, 370, 567 [Google Scholar]
- Geller, A. M., & Mathieu, R. D. 2012, AJ, 144, 54 [NASA ADS] [CrossRef] [Google Scholar]
- Giersz, M., Heggie, D. C., Hurley, J. R., et al. 2013, MNRAS, 431, 2184 [NASA ADS] [CrossRef] [Google Scholar]
- Gilliland, R. L., Bono, G., Edmonds, P. D., et al. 1998, ApJ, 507, 818 [CrossRef] [Google Scholar]
- Giusti, C., Cadelano, M., Ferraro, F. R., et al. 2024, A&A, 687, A310 [NASA ADS] [CrossRef] [EDP Sciences] [Google Scholar]
- Giusti, C., Cadelano, M., Ferraro, F. R., et al. 2025, A&A, 699, A143 [Google Scholar]
- Goodman, J., & Hut, P. 1989, Nature, 339, 6219, 40 [Google Scholar]
- Gosnell, N. M., Mathieu, R. D., Geller, A. M., et al. 2014, ApJ, 783, L8 [Google Scholar]
- Gosnell, N. M., Mathieu, R. D., Geller, A. M., et al. 2015, ApJ, 814, 163 [Google Scholar]
- Harris, W. E. 1996, AJ, 112, 1487 [Google Scholar]
- Heggie, D. C., & Giersz, M. 2009, MNRAS, 397, L46 [Google Scholar]
- Heggie, D., & Hut, P. 2003, Class. Quant. Grav., 20, 4504 [Google Scholar]
- Heggie, D. C., Trenti, M., & Hut, P. 2006, MNRAS, 368, 677 [CrossRef] [Google Scholar]
- Hills, J. G., & Day, C. A. 1976, Astrophys. Lett., 17, 87 [NASA ADS] [Google Scholar]
- King, I. R. 1966, AJ, 71, 64 [Google Scholar]
- Knigge, C., Leigh, N., & Sills, A. 2009, Nature, 457, 288 [NASA ADS] [CrossRef] [Google Scholar]
- Lanzoni, B., Ferraro, F. R., Alessandrini, E., et al. 2016, ApJ, 833, L29 [NASA ADS] [CrossRef] [Google Scholar]
- Lovisi, L., Mucciarelli, A., Ferraro, F. R., et al. 2010, ApJ, 719, L121 [NASA ADS] [CrossRef] [Google Scholar]
- Lovisi, L., Mucciarelli, A., Lanzoni, B., et al. 2012, ApJ, 754, 91 [Google Scholar]
- Lovisi, L., Mucciarelli, A., Dalessandro, E., et al. 2013, ApJ, 778, 64 [NASA ADS] [CrossRef] [Google Scholar]
- Mathieu, R. D., & Geller, A. M. 2009, Nature, 462, 1032 [NASA ADS] [CrossRef] [Google Scholar]
- McCrea, W. H. 1964, MNRAS, 128, 147 [Google Scholar]
- McMillan, S., Hut, P., & Makino, J. 1990, ApJ, 362, 522 [NASA ADS] [CrossRef] [Google Scholar]
- Meylan, G., & Heggie, D. C. 1997, A&ARev., 8, 1 [NASA ADS] [Google Scholar]
- Miocchi, P., Lanzoni, B., Ferraro, F. R., et al. 2013, ApJ, 774, 151 [Google Scholar]
- Ortolani, S., Barbuy, B., & Bica, E. 1999, A&AS, 136, 237 [Google Scholar]
- Perets, H. B., & Fabrycky, D. C. 2009, ApJ, 697, 1048 [Google Scholar]
- Pietrinferni, A., Cassisi, S., Salaris, M., et al. 2013, A&A, 558, A46 [NASA ADS] [CrossRef] [EDP Sciences] [Google Scholar]
- Piotto, G., Milone, A. P., Bedin, L. R., et al. 2015, AJ, 149, 91 [Google Scholar]
- Portegies Zwart, S. 2019, A&A, 621, L10 [NASA ADS] [CrossRef] [EDP Sciences] [Google Scholar]
- Raso, S., Ferraro, F. R., Dalessandro, E., et al. 2017, ApJ, 839, 64 [NASA ADS] [CrossRef] [Google Scholar]
- Raso, S., Pallanca, C., Ferraro, F. R., et al. 2019, ApJ, 879, 56 [NASA ADS] [CrossRef] [Google Scholar]
- Reggiani, E., Cadelano, M., Lanzoni, B., et al. 2025, A&A, 702, A185 [NASA ADS] [CrossRef] [EDP Sciences] [Google Scholar]
- Shara, M. M., Saffer, R. A., & Livio, M. 1997, ApJ, 489, L59 [NASA ADS] [CrossRef] [Google Scholar]
- Sills, A., Adams, T., & Davies, M. B. 2005, MNRAS, 358, 716 [NASA ADS] [CrossRef] [Google Scholar]
- Stetson, P. B., Pancino, E., Zocchi, A., et al. 2019, MNRAS, 485, 3042 [NASA ADS] [CrossRef] [Google Scholar]
- Tiongco, M. A., Vesperini, E., & Varri, A. L. 2016, MNRAS, 461, 402 [NASA ADS] [CrossRef] [Google Scholar]
- Trenti, M., Heggie, D. C., & Hut, P. 2007, MNRAS, 374, 344 [NASA ADS] [CrossRef] [Google Scholar]
- Vesperini, E., & Chernoff, D. F. 1994, ApJ, 431, 231 [Google Scholar]
- Webb, J. J., & Vesperini, E. 2017, MNRAS, 464, 1977 [NASA ADS] [CrossRef] [Google Scholar]
- Ying, J. (Martin), Chaboyer, B., Boylan-Kolchin, M., et al. 2025, ApJ, 987, 52 [Google Scholar]
We tried to adopt the same strategy for the PCC clusters NGC 6397 and NGC 7078 (M15). However, no acceptable King model fits to the observed density profiles could be found, and we therefore excluded these systems from the analyzed sample.
We verified that the same holds if the values of rh listed in Holger Baumgardt's online catalog are adopted (see https://people.smp.uq.edu.au/HolgerBaumgardt/globular/parameter.html).
Appendix A Parameters of the surveyed clusters
The values of the main structural parameters (namely, the King concentration and half-mass radius), central relaxation time, and nCRD parameters for each of the surveyed cluster are listed in Table A.1.
King concentration, half-mass radius, central relaxation time, and nCRD parameters with their uncertainties, for the 40 Galactic GCs studied in this work.
All Tables
King concentration, half-mass radius, central relaxation time, and nCRD parameters with their uncertainties, for the 40 Galactic GCs studied in this work.
All Figures
|
Fig. 1 Projected density profile corrected for Galactic-field contamination (black circles) for the PCC clusters NGC 6624, NGC 6681, and NGC 7099 (left, central, and right panels, respectively). In each case, the values of the best-fit King (1966) model parameters are labeled, and the bottom panel shows the residuals between the model and the observations. |
| In the text | |
|
Fig. 2 Observed nCRDs of the 40 GCs analyzed in this work. The red lines refer to the four PCC systems in the sample, and the blue lines refer to the other GCs. The right panel shows a zoomed-in view of the innermost region (out to 0.05 × rh), where the nCRD parameters are measured. In both panels, the gray shaded areas correspond to the region occupied by the nCRDs of the B24 simulated clusters. |
| In the text | |
|
Fig. 3 P5 parameter plotted as a function of A5 for the 40 surveyed GCs, with the blue circles referring to pre-CC systems and the red squares marking PCC clusters. The gray circles show the results from the Monte Carlo simulations of B24. The dashed lines mark the limits in A5 and P5 proposed by B24 as boundaries to separate pre-CC from PCC clusters. The solid lines mark the revised limits proposed here. |
| In the text | |
|
Fig. 4 A5 parameter as a function of the best-fit King model concentration c for the observed clusters (colored symbols, as in Fig. 3) and for the B24 simulations (gray circles). The solid horizontal line marks the proposed A5 boundary separating pre-CC from PCC systems. The thick black curve traces the values of A5 calculated from the integration of King density profiles of varying concentration parameters, c. |
| In the text | |
|
Fig. 5 A5 and P5, parameters (right and left panels, respectively) as a function of the central relaxation time, in logarithmic units. The meaning of the symbols and horizontal line is the same as in Fig. 4. The gray symbols encircled in green and orange correspond, respectively, to the simulated clusters that, at an age of 13 Gyr, host a central IMBH (green) and at least 30 stellar-mass BHs (orange). |
| In the text | |
|
Fig. 6 Logarithm of A5 and P5 as a function of the A+rh parameter (left and right panels, respectively). The solid and dashed lines mark, respectively, the boundaries between pre-CC and PCC systems as proposed in the present work (A5 > 0.008, P5 > 0.47) and in Ferraro et al. (2023b, A+rh = 0.3). |
| In the text | |
Current usage metrics show cumulative count of Article Views (full-text article views including HTML views, PDF and ePub downloads, according to the available data) and Abstracts Views on Vision4Press platform.
Data correspond to usage on the plateform after 2015. The current usage metrics is available 48-96 hours after online publication and is updated daily on week days.
Initial download of the metrics may take a while.