Fig. 5
Download original image
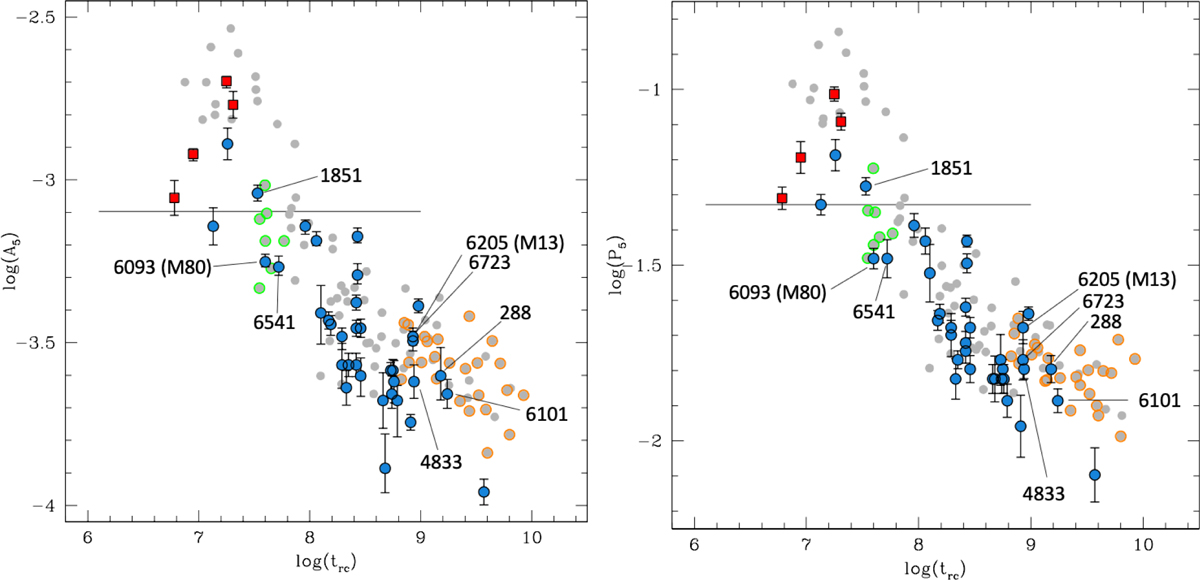
A5 and P5, parameters (right and left panels, respectively) as a function of the central relaxation time, in logarithmic units. The meaning of the symbols and horizontal line is the same as in Fig. 4. The gray symbols encircled in green and orange correspond, respectively, to the simulated clusters that, at an age of 13 Gyr, host a central IMBH (green) and at least 30 stellar-mass BHs (orange).
Current usage metrics show cumulative count of Article Views (full-text article views including HTML views, PDF and ePub downloads, according to the available data) and Abstracts Views on Vision4Press platform.
Data correspond to usage on the plateform after 2015. The current usage metrics is available 48-96 hours after online publication and is updated daily on week days.
Initial download of the metrics may take a while.