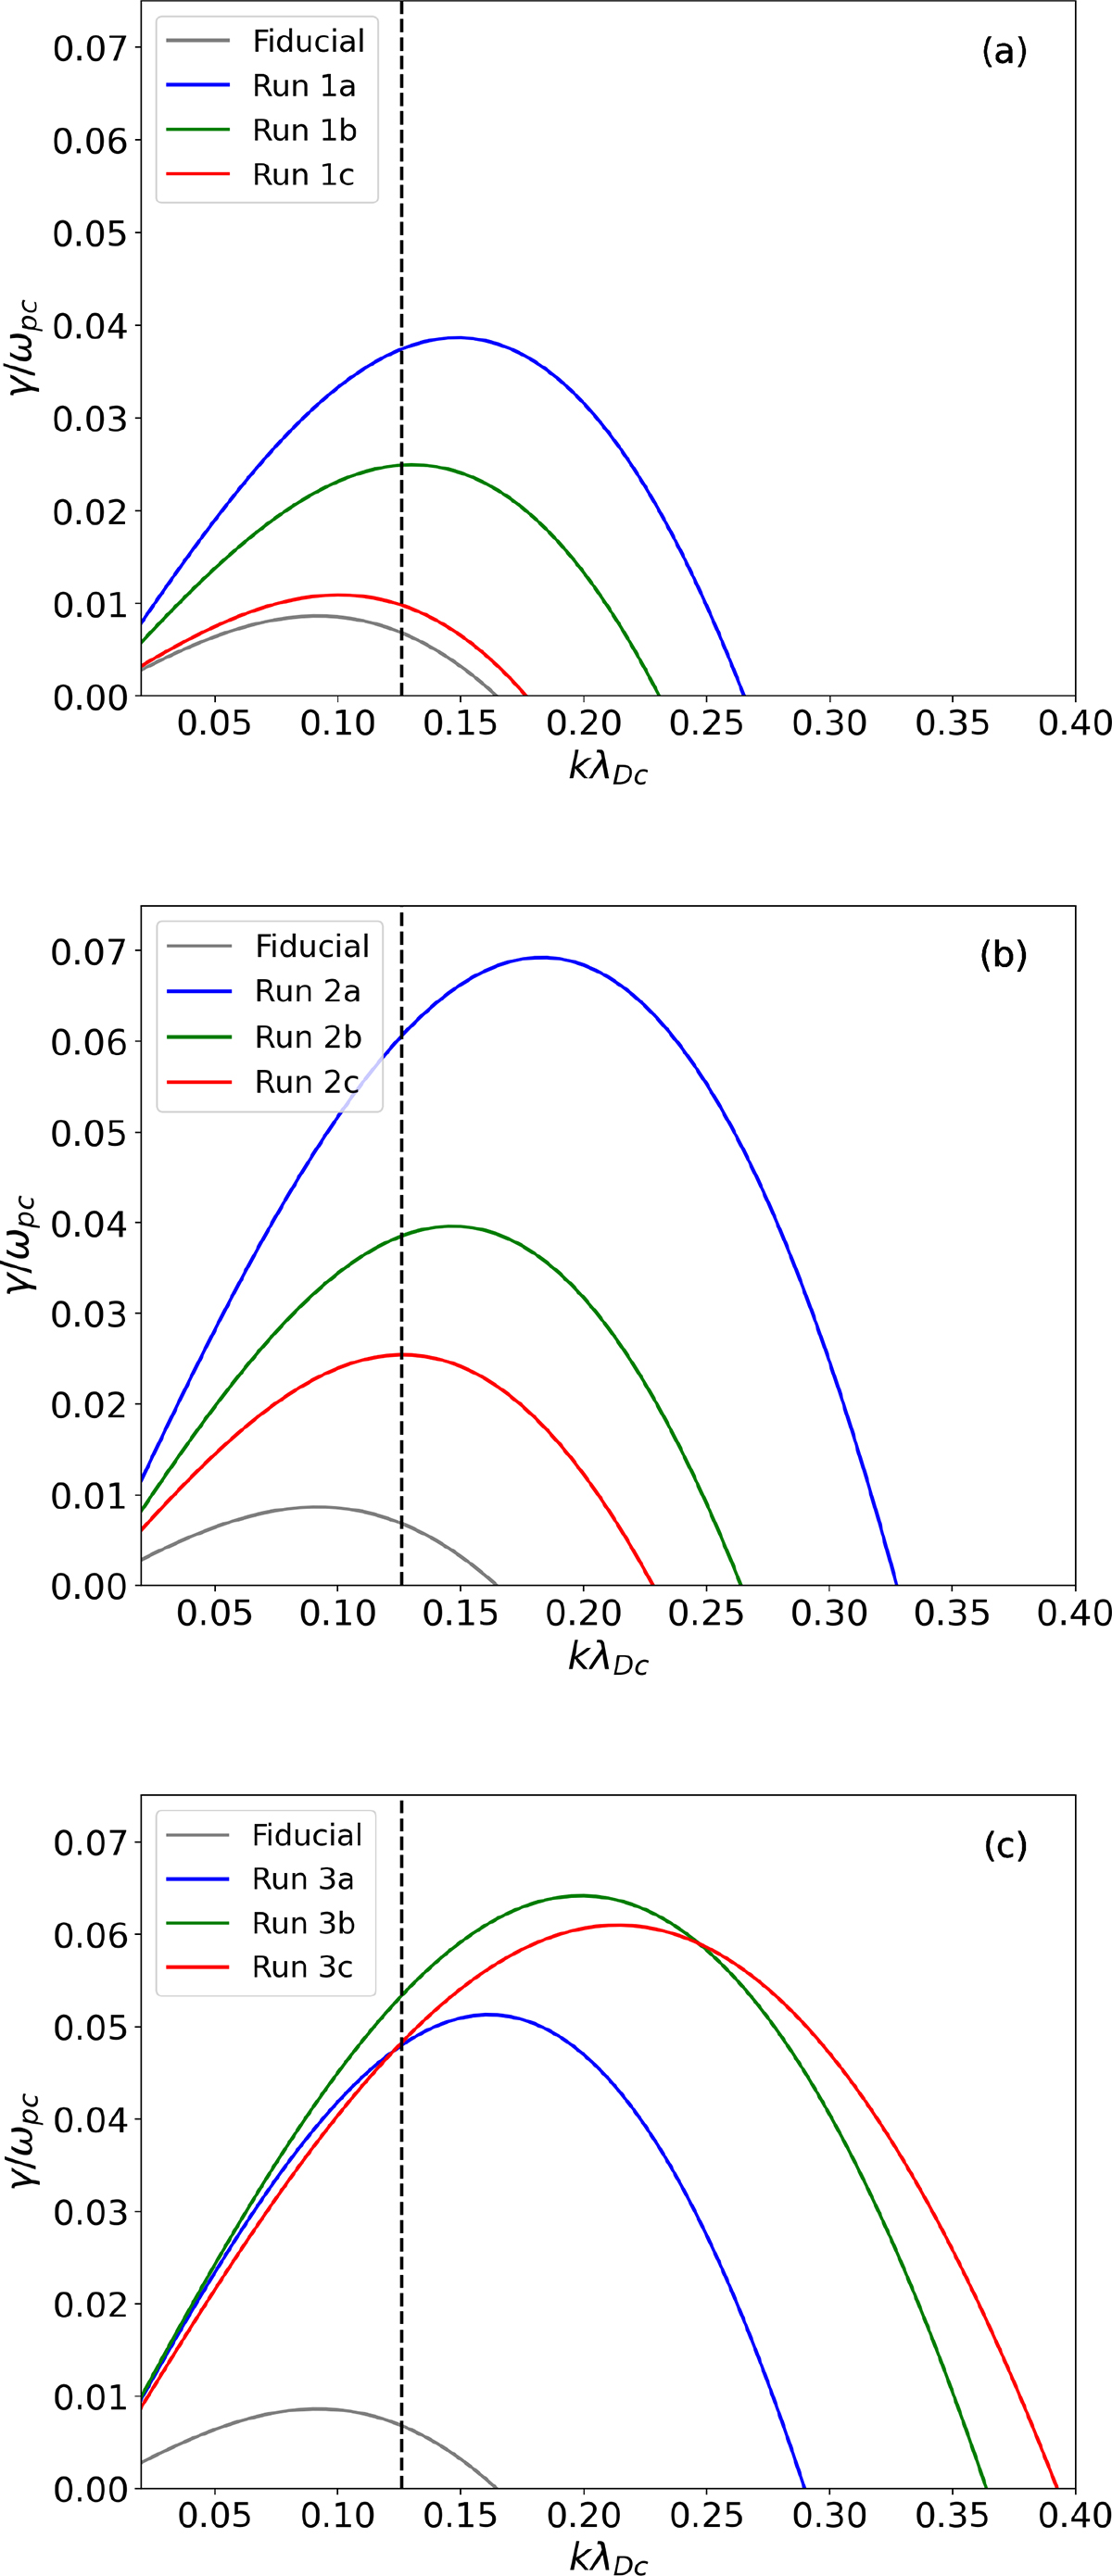
Fig. 1.
Download original image
Normalized growth rate, γ/ωpc vs. normalized wavenumber kλDc from Eq. (4) for the IIAI with parameters given by Table 1. Panels a, b, and c depict Series 1, 2, and 3, respectively, with the fiducial run shown by the gray curve. These theoretical expectations are compared with simulation results in Table 2. The vertical dashed lines refer to the simulated wavenumber (kλDc = 0.126).
Current usage metrics show cumulative count of Article Views (full-text article views including HTML views, PDF and ePub downloads, according to the available data) and Abstracts Views on Vision4Press platform.
Data correspond to usage on the plateform after 2015. The current usage metrics is available 48-96 hours after online publication and is updated daily on week days.
Initial download of the metrics may take a while.