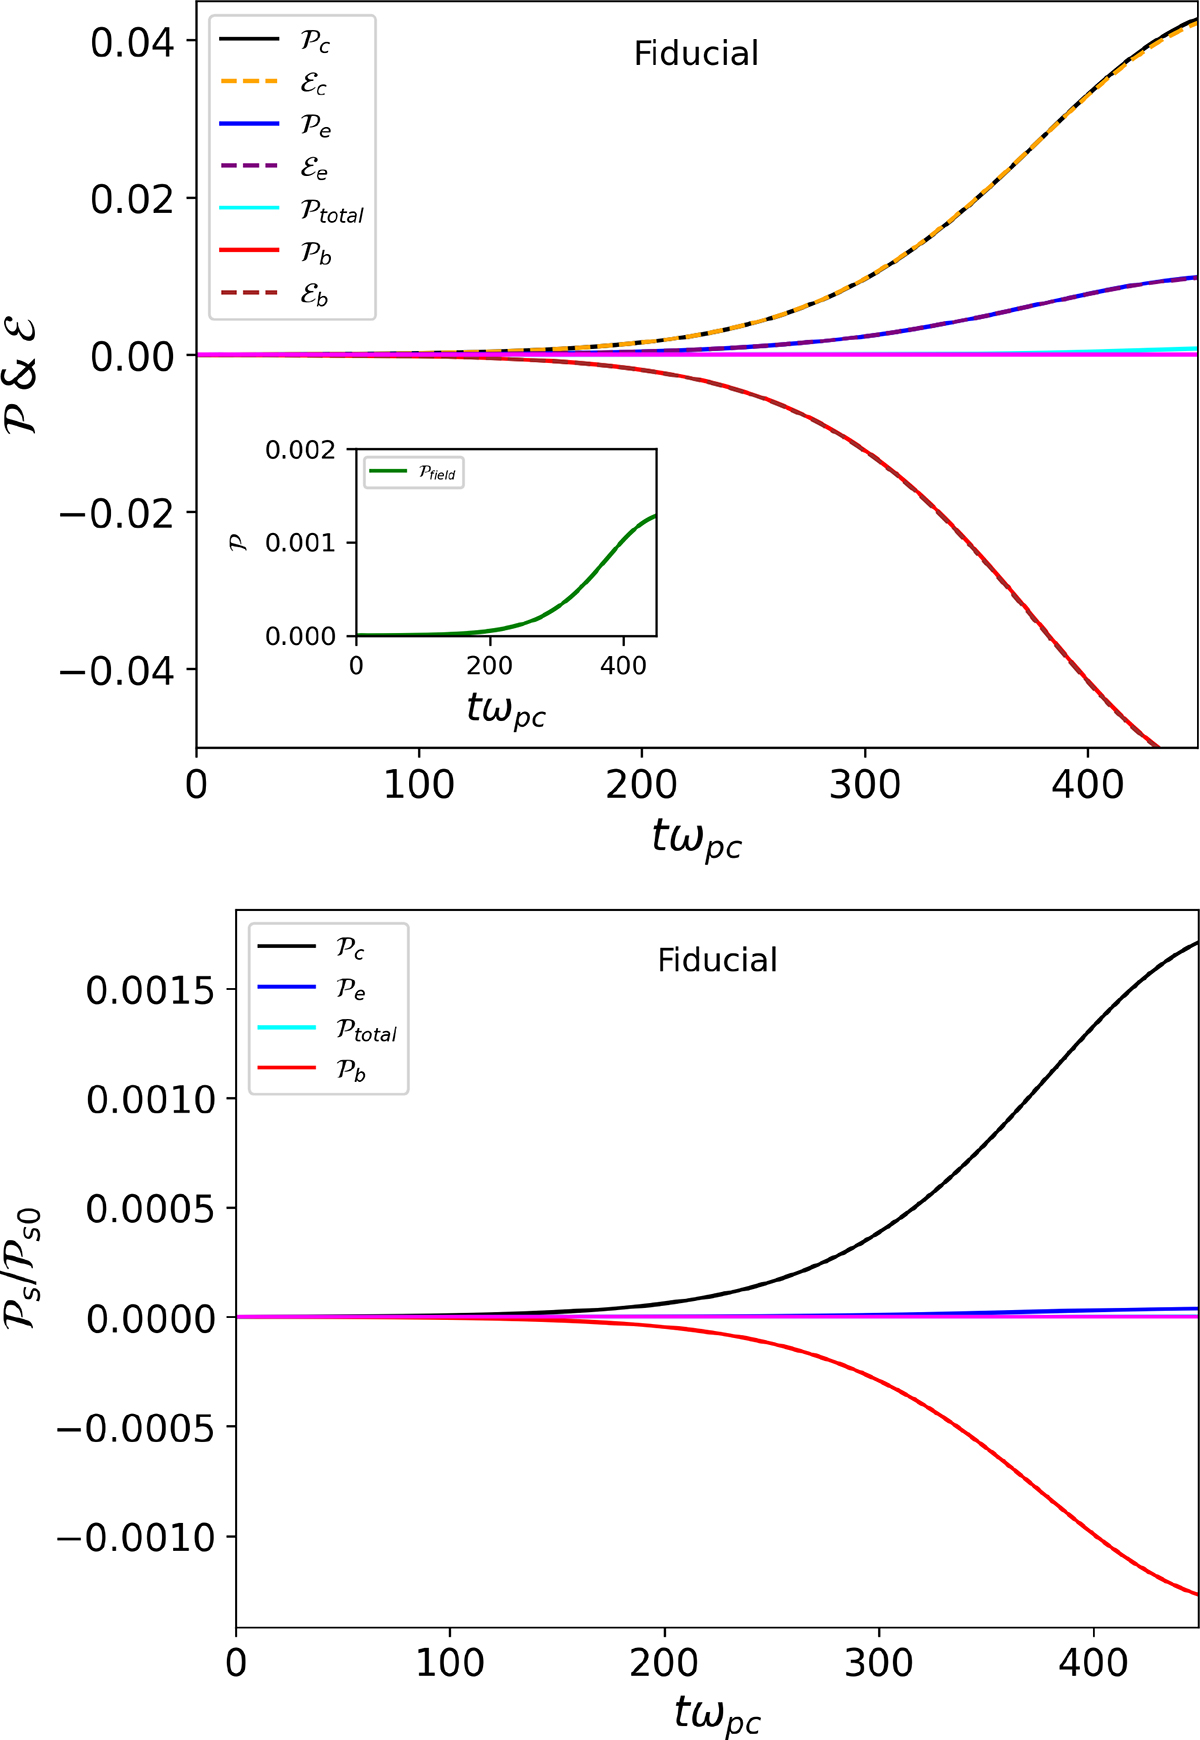
Fig. 3.
Download original image
Energy evolution in the fiducial run. Upper panel: Energy variation of the different particle populations (solid lines), the total energy, and the electric field energy (inset) calculated as Eq. (8). Also shown is the energy variation for the particle populations (dashed lines) calculated as Eq. (7). Lower panel: 𝒫s/𝒫s0 for the three particle populations and for the total energy. The horizontal solid magenta line at zero separates positive and negative values of 𝒫 and ℰ.
Current usage metrics show cumulative count of Article Views (full-text article views including HTML views, PDF and ePub downloads, according to the available data) and Abstracts Views on Vision4Press platform.
Data correspond to usage on the plateform after 2015. The current usage metrics is available 48-96 hours after online publication and is updated daily on week days.
Initial download of the metrics may take a while.