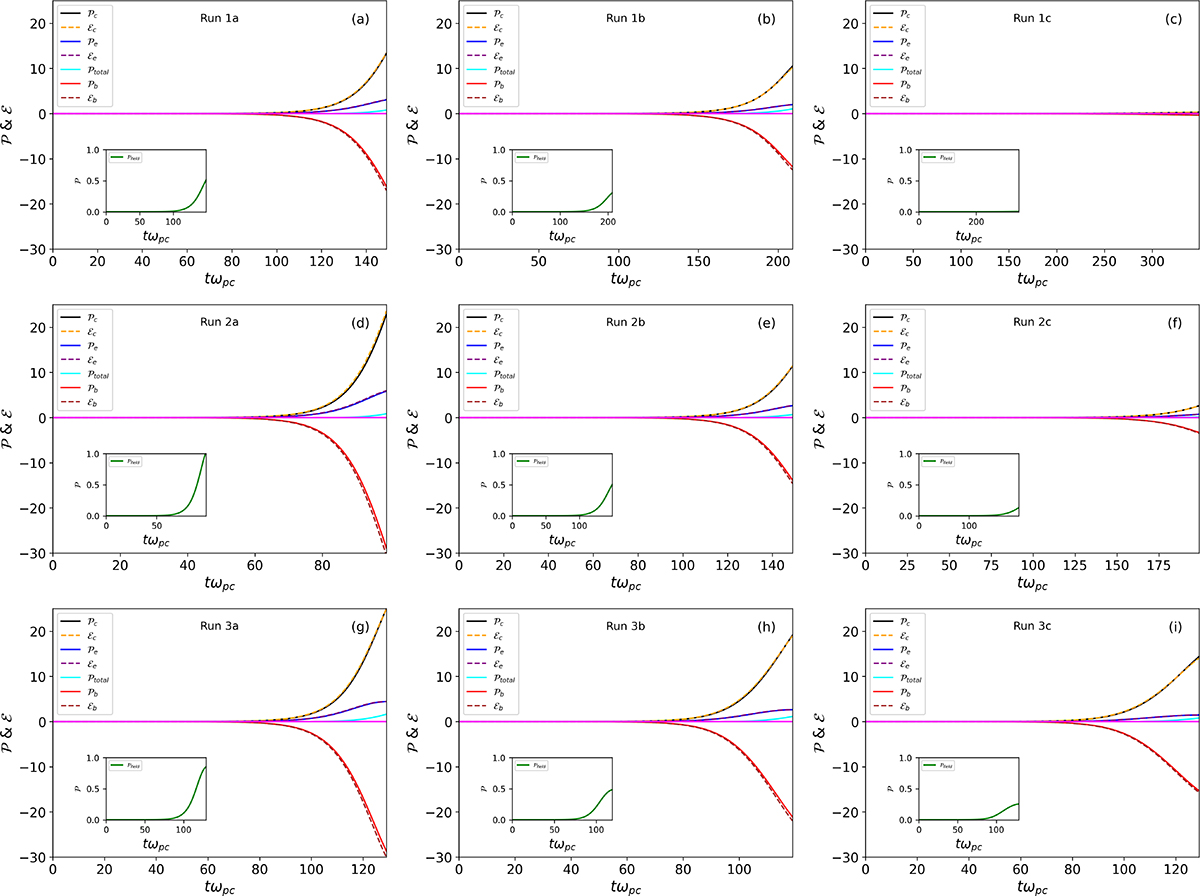
Fig. 4.
Download original image
Energy evolution for the three simulation series. The change in the particles, field, and total kinetic energy (solid lines, 𝒫), and the net energy exchange rate (dashed lines, ℰ), for Series 1 (first row), Series 2 (second row), and Series 3 (third row) runs in Table 1. Same as in Fig. 3, with the horizontal zero line indicating the separation between positive and negative values.
Current usage metrics show cumulative count of Article Views (full-text article views including HTML views, PDF and ePub downloads, according to the available data) and Abstracts Views on Vision4Press platform.
Data correspond to usage on the plateform after 2015. The current usage metrics is available 48-96 hours after online publication and is updated daily on week days.
Initial download of the metrics may take a while.