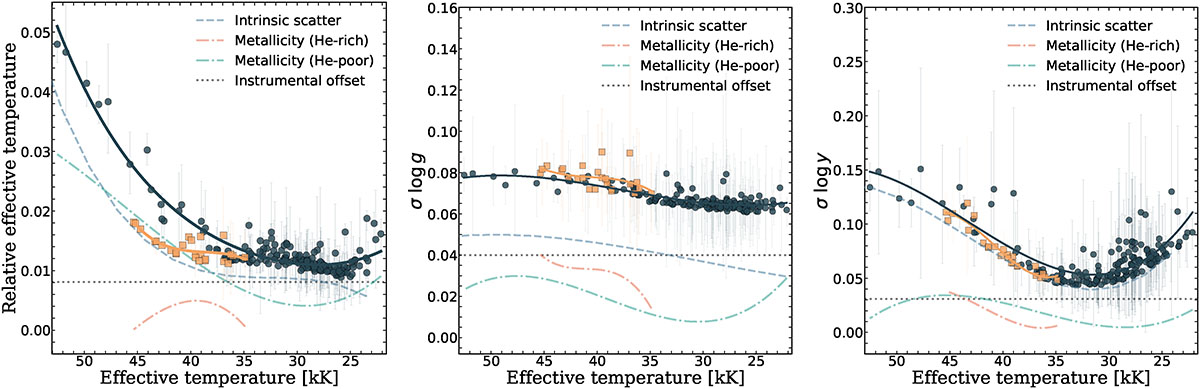
Fig. 2.
Download original image
Three-panel figure showing our best estimates of the overall uncertainties in Teff, log g, and log n(He)/n(H) (from left to right), displayed as scattered markers. The Teff uncertainties are plotted as fractional values (ΔTeff/Teff, i.e. 1–5%). Helium-rich and helium-poor stars are separated and indicated as orange squares and dark blue circles, respectively. The solid orange and dark blue lines are polynomial fits (Equation (1)) to these scattered markers, and the coefficients of these are given in Table A.2. The dashed polynomials represent the identified uncertainty contributions from the intrinsic scatter measured in our INT data and from the metallicity abundance uncertainty, as described in Sect. 4.2. The formal statistical errors are given by the error bars of the scattered markers and the instrumental offset between INT and ALFOSC is given by a black-dashed line. All four identified uncertainties are added together in quadrature to arrive at the uncertainties used for the analysis in this work.
Current usage metrics show cumulative count of Article Views (full-text article views including HTML views, PDF and ePub downloads, according to the available data) and Abstracts Views on Vision4Press platform.
Data correspond to usage on the plateform after 2015. The current usage metrics is available 48-96 hours after online publication and is updated daily on week days.
Initial download of the metrics may take a while.