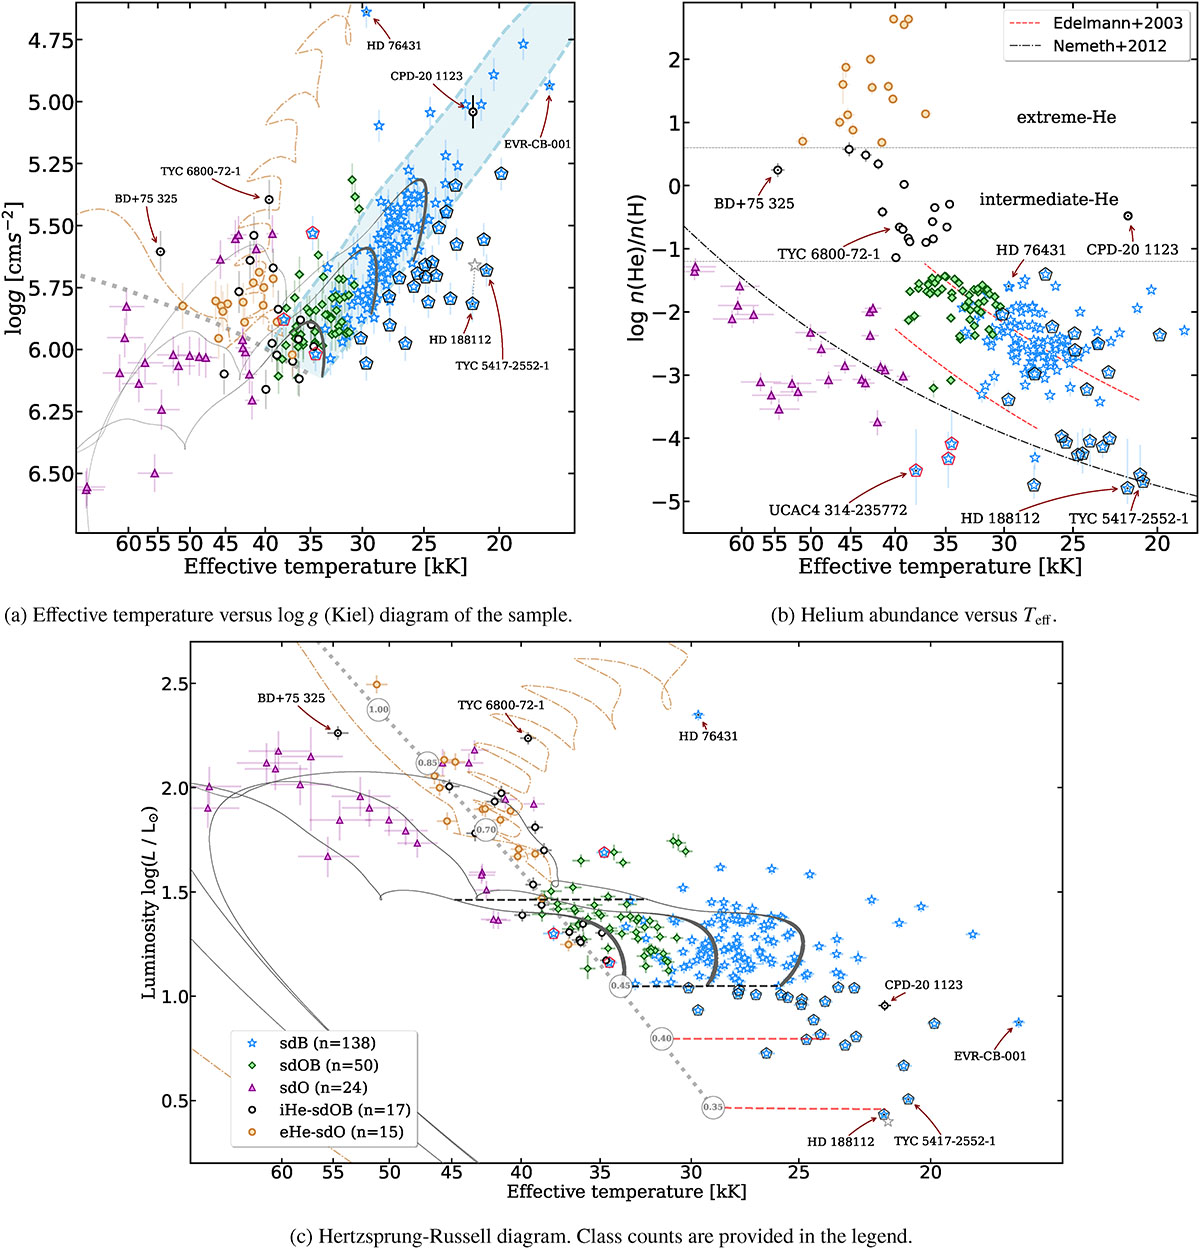
Fig. 3.
Download original image
Upper left: Teff − log g diagram of the hot subdwarf stars in the 500 pc sample, colour-coded as shown in the legend (lower panel). Three post-EHB evolutionary tracks for three different envelope masses from Han et al. (2003) are given as solid-black lines: 0.00, 0.001, and 0.005 M⊙ from bottom to top (Mtotal = 0.45 M⊙). The thickness of the lines are linearly proportional to the predicted evolutionary time. A double He-WD merger track from Zhang & Jeffery (2012) is shown as a orange dot-dashed line. The region encapsulated by the zero-age EHB and the terminal-age EHB from Dorman et al. (1993) is depicted as a shaded light-blue region which extends down to the He-MS from Paczyński (1971) which is shown as a dotted-grey line. All tracks are given for solar metallicity. Upper right: helium abundance – Teff diagram for the same stars. The helium sequences identified in earlier studies (Edelmann et al. 2003; Németh et al. 2012; Luo et al. 2016; Lei et al. 2018) are shown. Bottom: Hertzsprung-Russell diagram with the same hot subdwarf classes and evolutionary tracks as shown in the upper left panel. The He-MS from Paczyński (1971) is again shown as a dotted-grey line with the corresponding masses annotated. The horizontal dashed-black lines indicate the solar metallicity ZAEHB at log L/L⊙ = 1.05 at the start of the 0.45 M⊙ evolutionary tracks from Han et al. (2002), and the TAEHB of these tracks at the point of core helium depletion. Two additional ZAEHB positions are marked as dashed-red lines for the 0.40 M⊙ and 0.35 M⊙ evolutionary tracks to compare with the low-luminosity objects. Black pentagons mark the underluminous hot subdwarfs (log L/L⊙ < 1.05) in all three plots. Crimson pentagons indicate the three identified hot and helium-poor stars. The grey star marks the previous position of HD 188112.
Current usage metrics show cumulative count of Article Views (full-text article views including HTML views, PDF and ePub downloads, according to the available data) and Abstracts Views on Vision4Press platform.
Data correspond to usage on the plateform after 2015. The current usage metrics is available 48-96 hours after online publication and is updated daily on week days.
Initial download of the metrics may take a while.