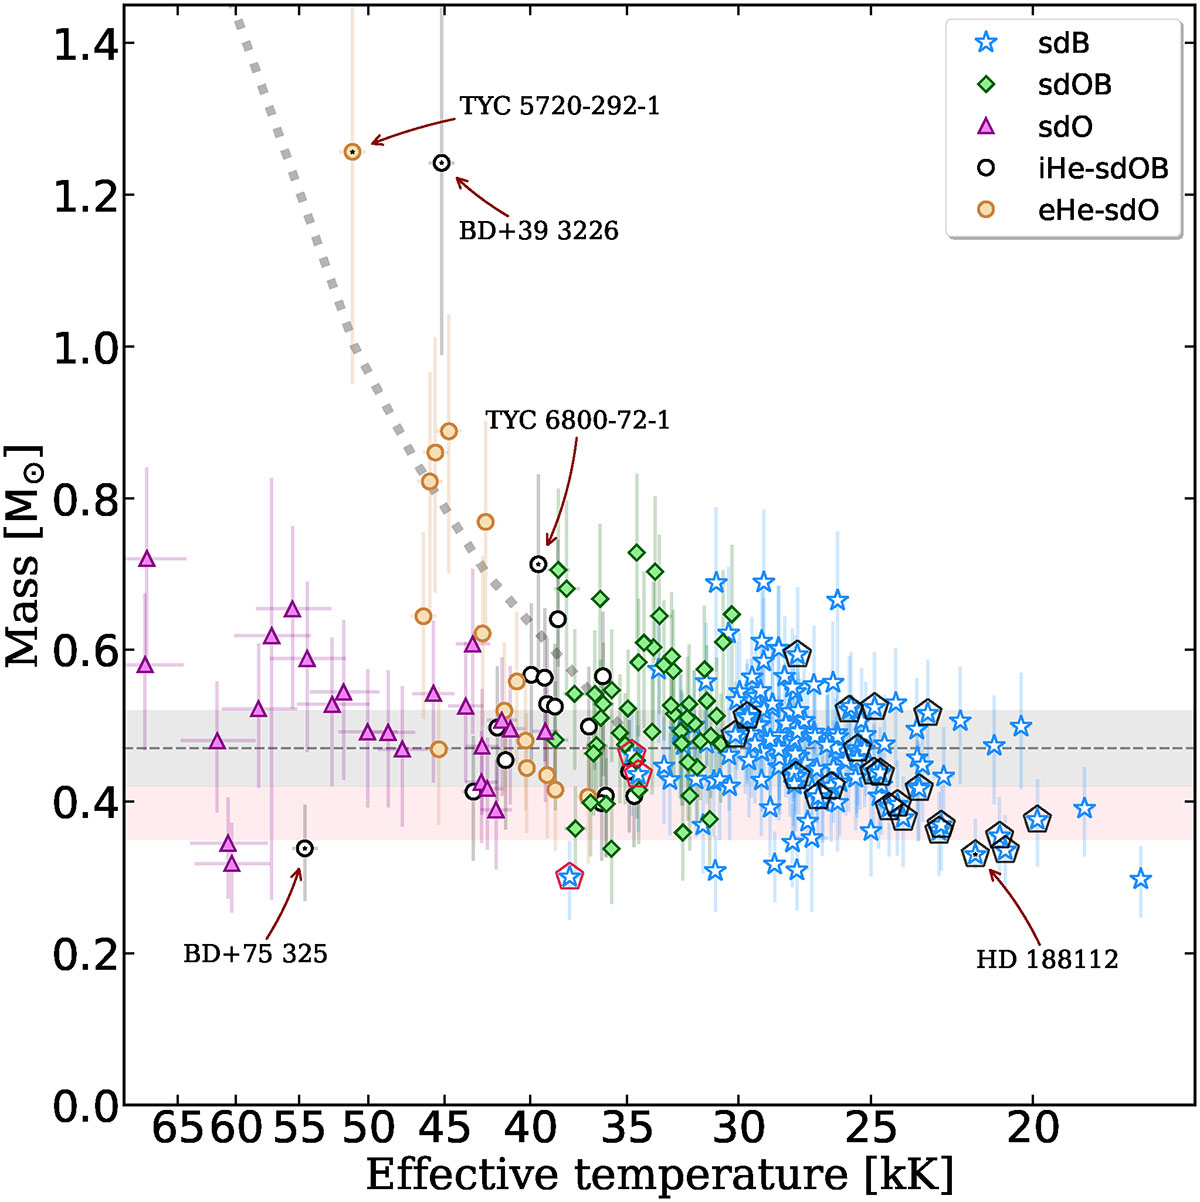
Fig. 4.
Download original image
Distribution of our stars in the mass – effective temperature plane. The He-MS (Paczyński 1971) is shown as a dashed grey line. The grey-shaded band is centred on a mass of 0.47 M⊙ and spans ±0.05 M⊙, corresponding to our mean uncertainties. The pink-shaded region extends down to 0.35 M⊙, the minimum core mass predicted by the evolutionary tracks of Han et al. (2002). Pentagons indicate the same stars as in Fig. 3.
Current usage metrics show cumulative count of Article Views (full-text article views including HTML views, PDF and ePub downloads, according to the available data) and Abstracts Views on Vision4Press platform.
Data correspond to usage on the plateform after 2015. The current usage metrics is available 48-96 hours after online publication and is updated daily on week days.
Initial download of the metrics may take a while.