Fig. 9.
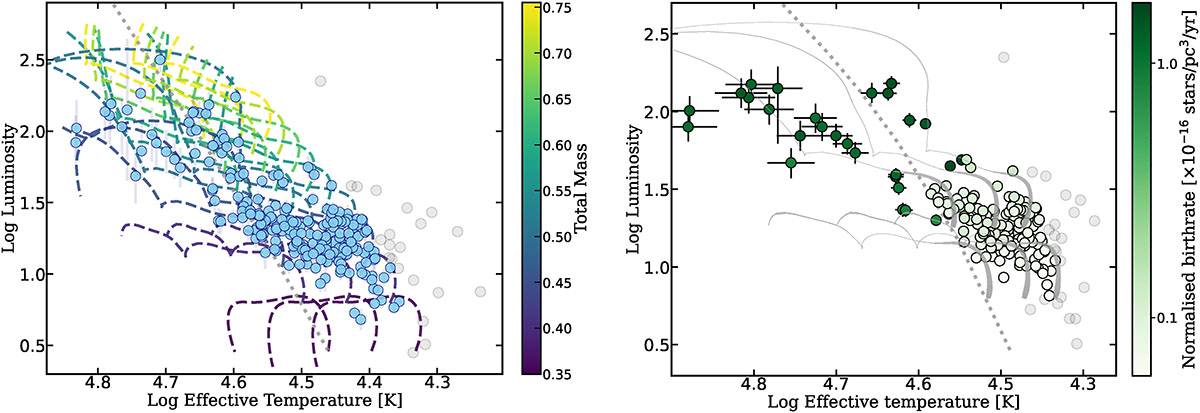
Download original image
Left: The 253 single-lined hot subdwarf stars shown in the HRD, overlaid with the full set of evolutionary tracks from Han et al. (2002), colour-coded by increasing core mass as indicated by the colour bar. The interpolation and MCMC procedure used to estimate theoretical stellar masses and ages is described in Sect. 7.1. Faded points lie outside the interpolated region and are therefore excluded from mass determination. Right: Same as in the left panel but displaying only the 0.40 and 0.50 M⊙ tracks from Han et al. (2002), and the 183 stars that fit to them. The colour scale shows our expected birthrate calculations as outlined in Sect. 7.5.
Current usage metrics show cumulative count of Article Views (full-text article views including HTML views, PDF and ePub downloads, according to the available data) and Abstracts Views on Vision4Press platform.
Data correspond to usage on the plateform after 2015. The current usage metrics is available 48-96 hours after online publication and is updated daily on week days.
Initial download of the metrics may take a while.