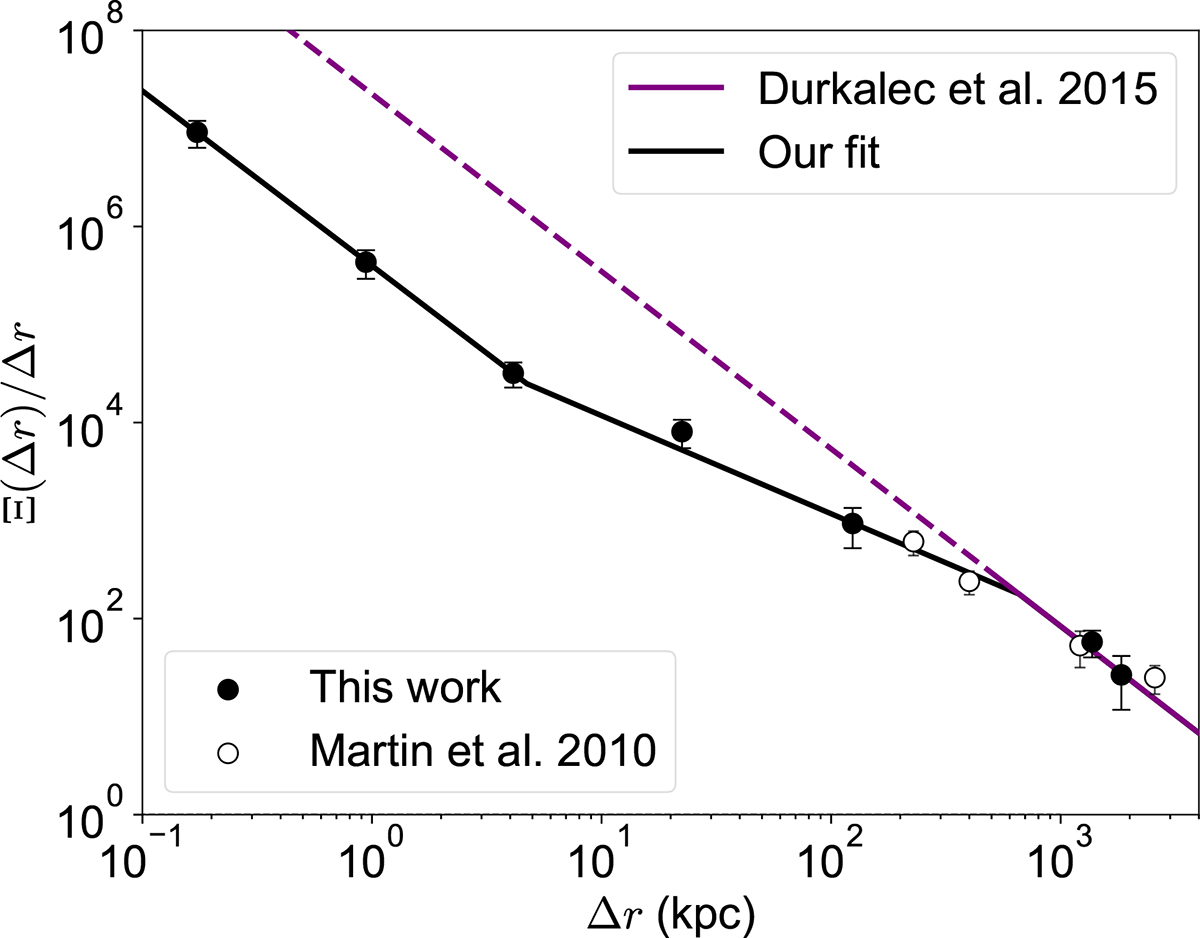
Fig. 6.
Download original image
Projected transverse correlation function (Ξ(Δr)) for C IV. The bins are the same as in Fig. 5. The open circle data points correspond to the measurements obtained by Martin et al. (2010), using the same velocity threshold and estimator. The solid purple line shows a galaxy-galaxy autocorrelation function result (Durkalec et al. 2015), with parameters ![]() Mpc and
Mpc and ![]() , and the dashed purple line is its extrapolation to small scales. The solid black line corresponds to the model of Eq. (13), which described further in the main text.
, and the dashed purple line is its extrapolation to small scales. The solid black line corresponds to the model of Eq. (13), which described further in the main text.
Current usage metrics show cumulative count of Article Views (full-text article views including HTML views, PDF and ePub downloads, according to the available data) and Abstracts Views on Vision4Press platform.
Data correspond to usage on the plateform after 2015. The current usage metrics is available 48-96 hours after online publication and is updated daily on week days.
Initial download of the metrics may take a while.