Fig. 7.
Download original image
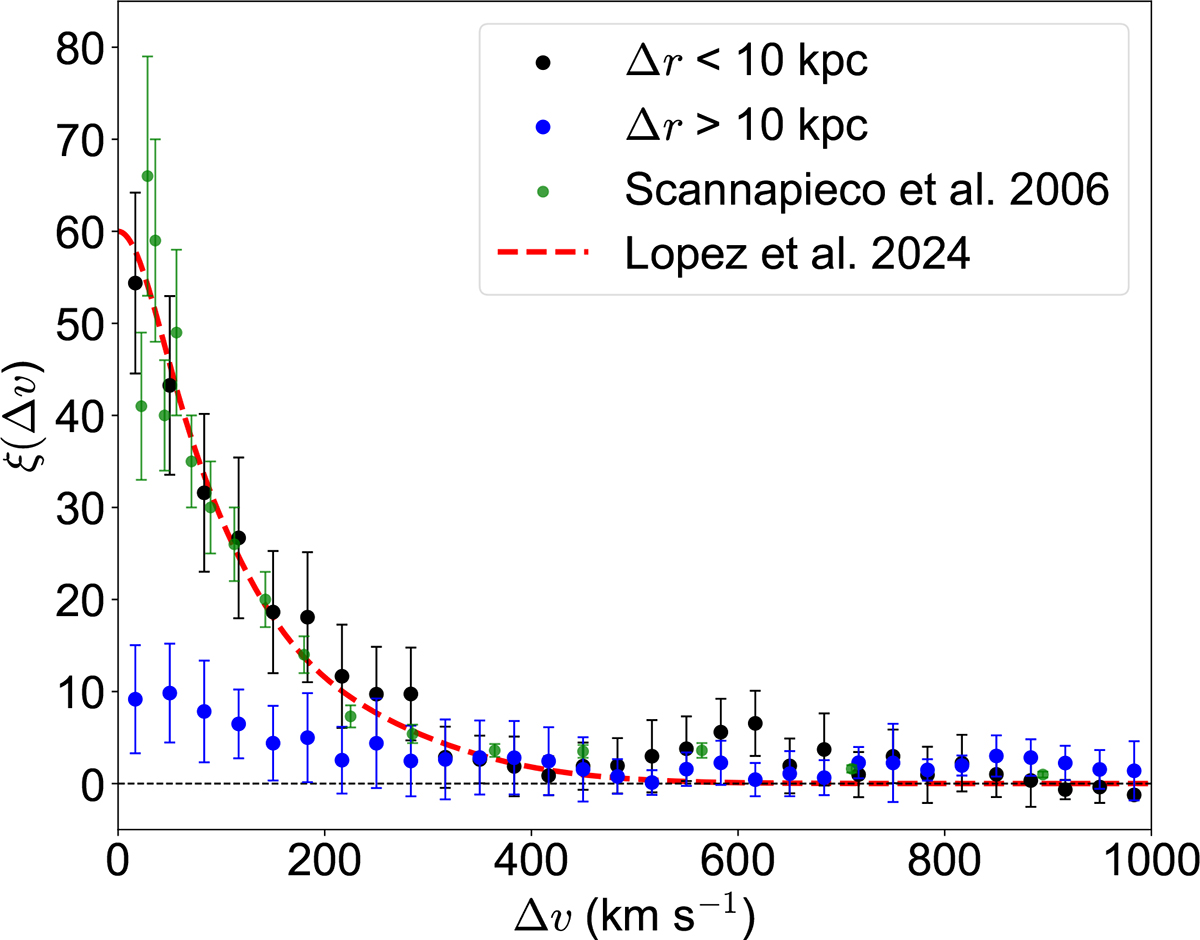
Two-point correlation function (ξ(Δv)) of C IV as a function of velocity across the two lines of sight for two different bins in separation, shown as the black and blue points for Δr < 10 kpc and Δr > 10 kpc, respectively. The green points correspond to the single line-of-sight measurements obtained by Scannapieco et al. (2006). The dashed red line shows a prediction from transverse correlations of C IV using gravitational arcs (Lopez et al. 2024), adjusted to account for the different spectral and spatial resolution.
Current usage metrics show cumulative count of Article Views (full-text article views including HTML views, PDF and ePub downloads, according to the available data) and Abstracts Views on Vision4Press platform.
Data correspond to usage on the plateform after 2015. The current usage metrics is available 48-96 hours after online publication and is updated daily on week days.
Initial download of the metrics may take a while.