Fig. 10
Download original image
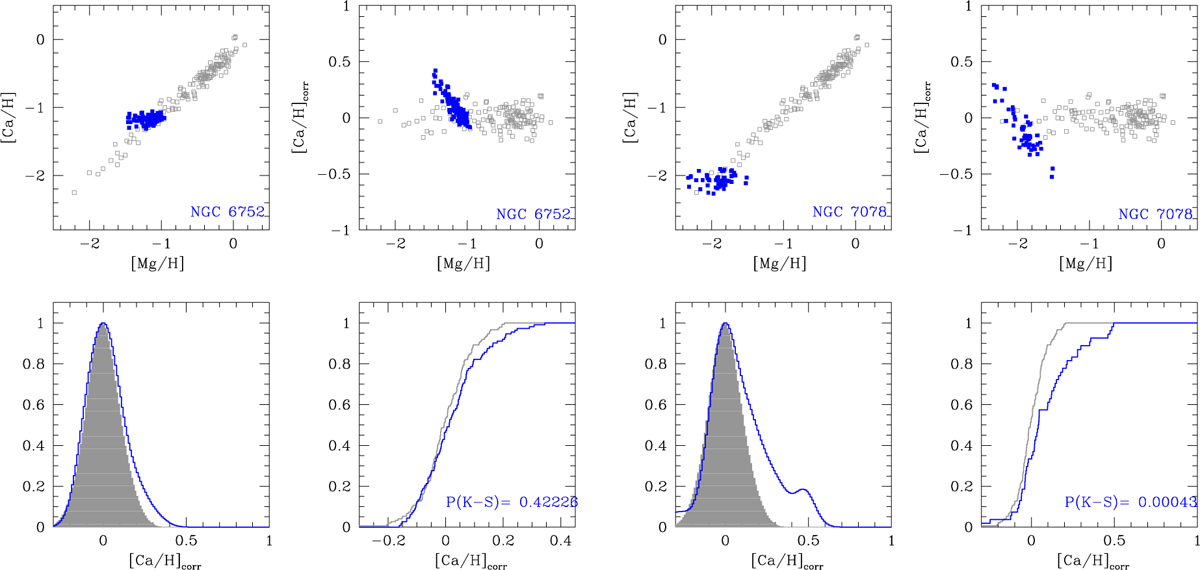
Detection of Ca excesses in NGC 6752 (left panels) and NGC 7078 (right panels). In the upper left panels GC stars (blue squares) are superimposed to field stars (with typical error of 0.08 dex), and all abundances are linearised in the upper right panels (see text). Generalised histograms of the [Ca/H] values for field (grey area) and GC stars (blue area) are in the lower left panels and the cumulative distributions are shown in the lower right panels, together with the probability of the two-tailed K-S test.
Current usage metrics show cumulative count of Article Views (full-text article views including HTML views, PDF and ePub downloads, according to the available data) and Abstracts Views on Vision4Press platform.
Data correspond to usage on the plateform after 2015. The current usage metrics is available 48-96 hours after online publication and is updated daily on week days.
Initial download of the metrics may take a while.