Fig. 12
Download original image
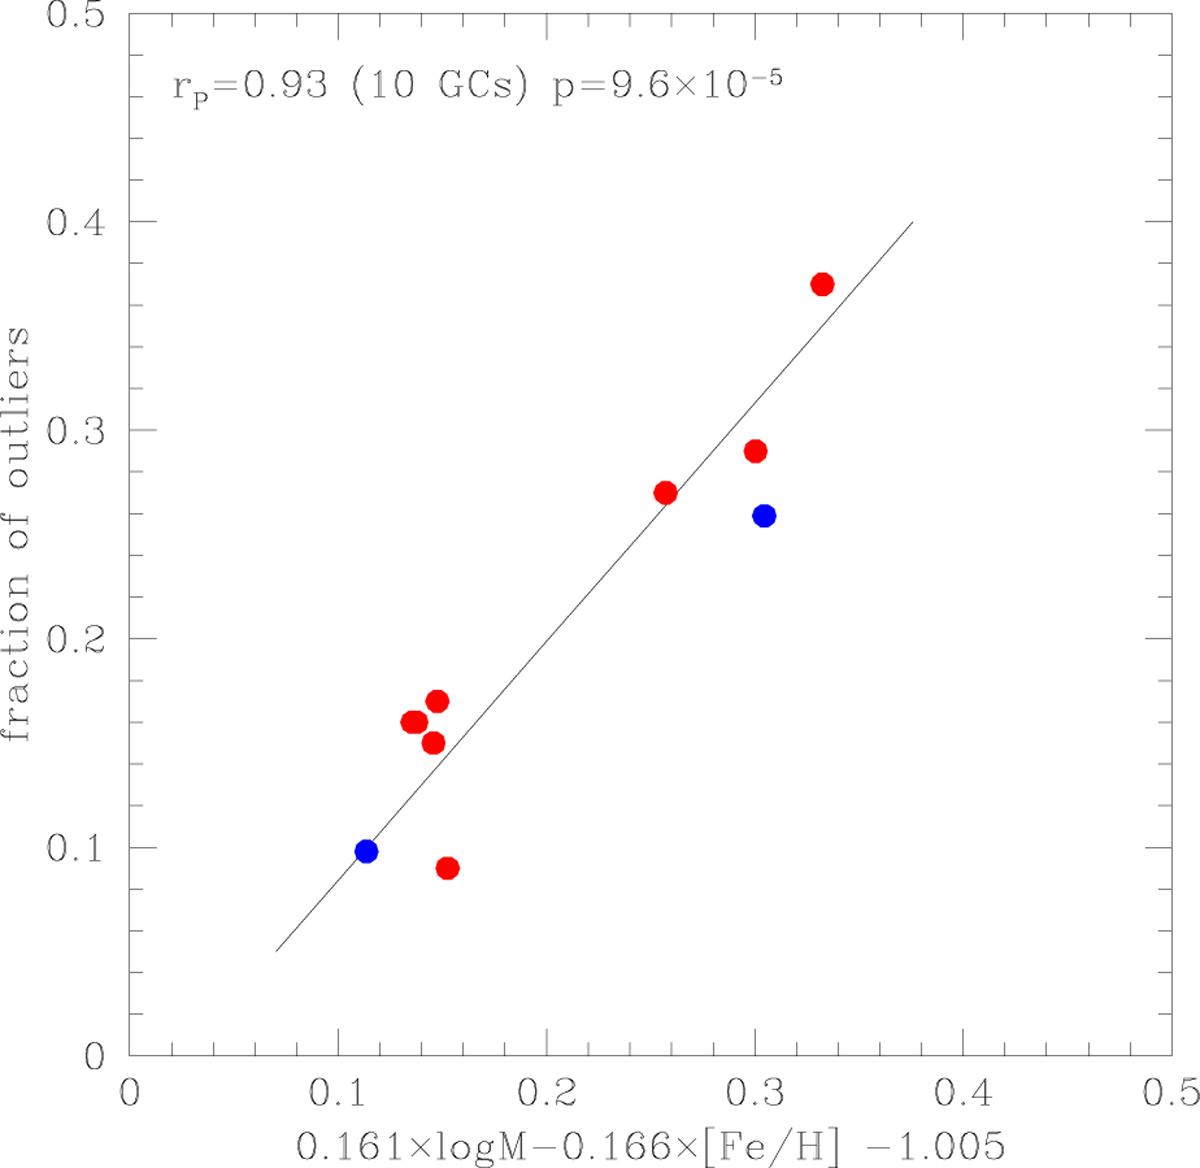
Fraction of stars with excesses of Ca in 8 GCs from the census in Carretta & Bragaglia (2021, red points)) as a function of a linear combination of GC mass (Baumgardt et al. 2019) and metallicity (Harris 2010). Blue points are for NGC 7078 and NGC 6752 from the present work. A linear fit is given by the solid line, with the Pearson’s correlation coefficient and the two-tailed probability listed in the panel.
Current usage metrics show cumulative count of Article Views (full-text article views including HTML views, PDF and ePub downloads, according to the available data) and Abstracts Views on Vision4Press platform.
Data correspond to usage on the plateform after 2015. The current usage metrics is available 48-96 hours after online publication and is updated daily on week days.
Initial download of the metrics may take a while.