Fig. 12
Download original image
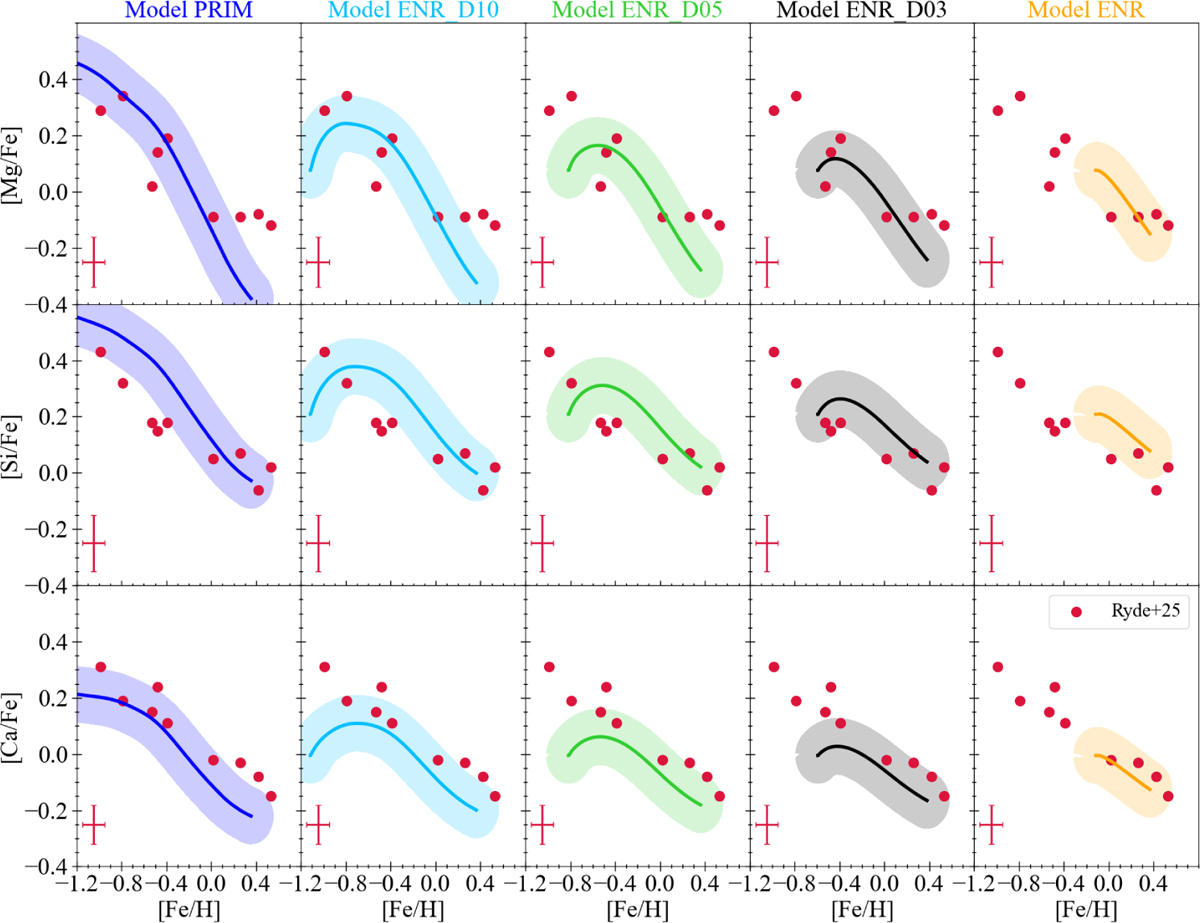
Comparison between model predictions and NSD data from Ryde et al. (2025, red points). Each panel shows the evolution of [Mg/Fe], [Si/Fe], and [Ca/Fe] as a function of [Fe/H], as predicted by the four chemical-evolution models considered in this work (PRIM, ENR_D10, ENR_D05, and ENR_D03; see Table 1 for the adopted parameters). Shaded regions around the model curves indicate the uncertainties obtained by Gaussian smoothing with σ[Fe/H] = 0.2 dex (this is consistent with the MDF fitting procedure) and σ[X/Fe] = 0.1 dex, where X denotes the considered element. Typical uncertainties of the Ryde et al. (2025) data are indicated in the lower left corner of each panel by a red cross.
Current usage metrics show cumulative count of Article Views (full-text article views including HTML views, PDF and ePub downloads, according to the available data) and Abstracts Views on Vision4Press platform.
Data correspond to usage on the plateform after 2015. The current usage metrics is available 48-96 hours after online publication and is updated daily on week days.
Initial download of the metrics may take a while.