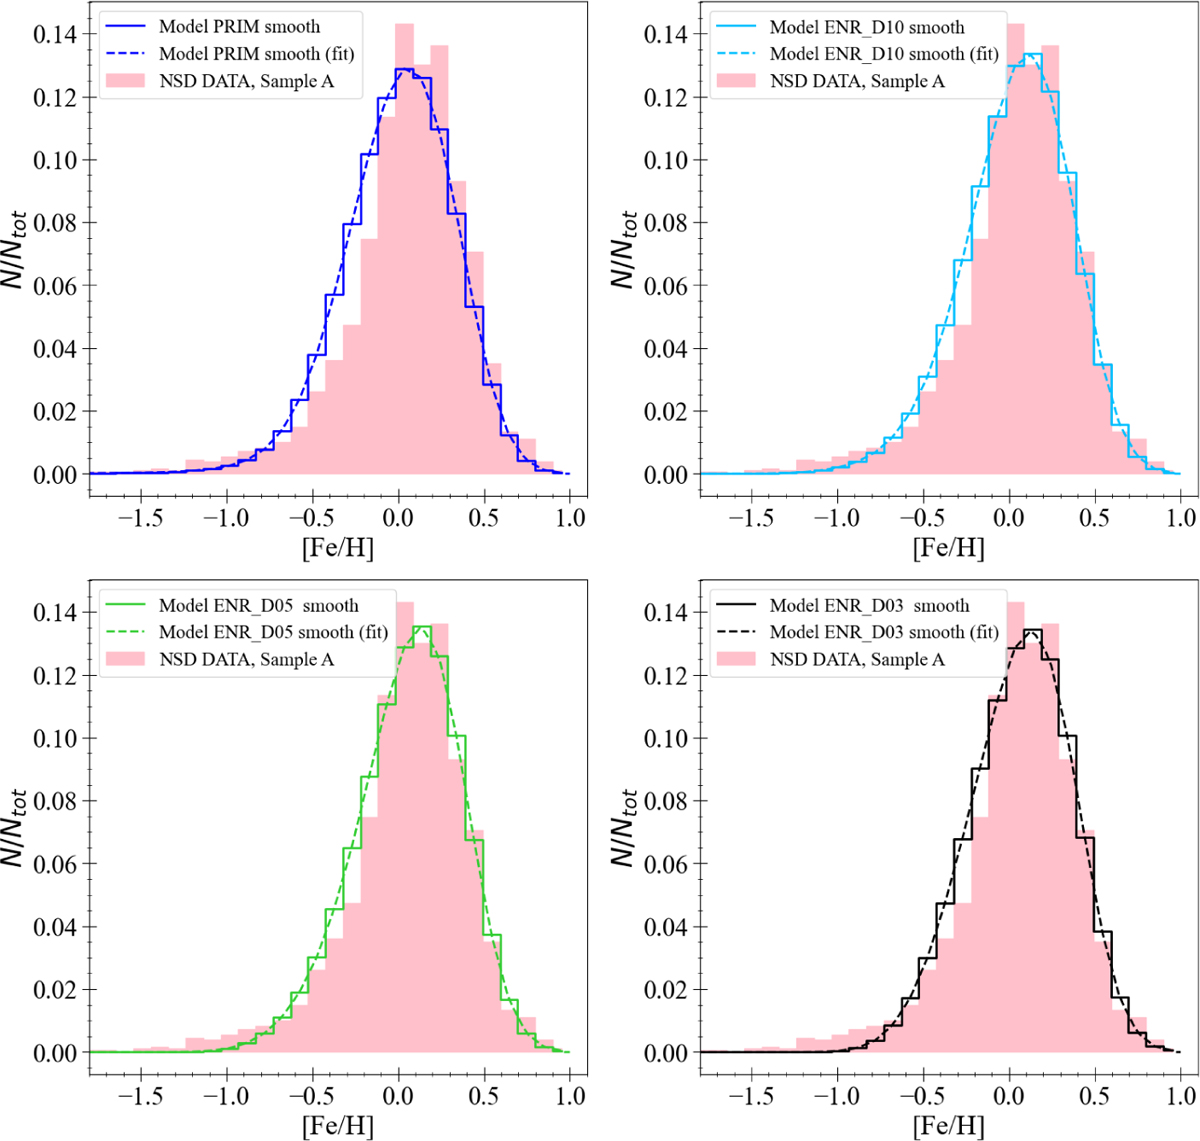
Fig. 3
Download original image
Comparison between observed NSD MDF (Sample A, filled distributions; see Section 3 for details) and the predictions of the best-fit models (with parameters listed in Table 1), after applying a Gaussian convolution with σ[Fe/H]=0.2 dex (‘Model smooth’). The analytical fit to this distribution, indicated as ‘smooth (fit)’ in the likelihood definition of Eq. (10), is also shown.
Current usage metrics show cumulative count of Article Views (full-text article views including HTML views, PDF and ePub downloads, according to the available data) and Abstracts Views on Vision4Press platform.
Data correspond to usage on the plateform after 2015. The current usage metrics is available 48-96 hours after online publication and is updated daily on week days.
Initial download of the metrics may take a while.