Fig. 1
Download original image
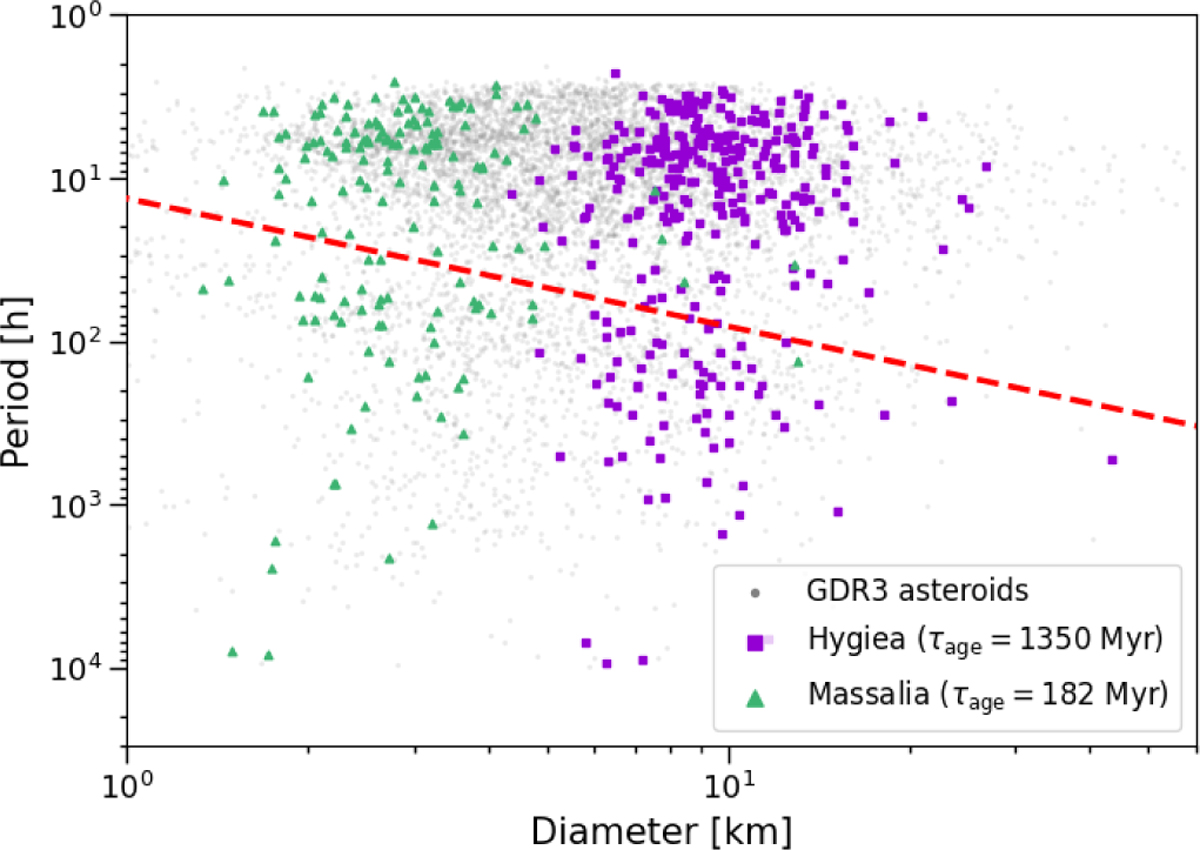
Observational data from Gaia (in gray) showing the perioddiameter distribution for asteroids. As purple squares we show the distribution of the Hygeia family, and as green triangles we show the distribution of the Massalia family. The dashed red line is the fit line that identifies the gap (Zhou et al. 2025). Spin period values were calculated by Durech & Hanus (2023) and Cellino et al. (2024). The ages in the legend are the weighted average ages computed from Spoto et al. (2015).
Current usage metrics show cumulative count of Article Views (full-text article views including HTML views, PDF and ePub downloads, according to the available data) and Abstracts Views on Vision4Press platform.
Data correspond to usage on the plateform after 2015. The current usage metrics is available 48-96 hours after online publication and is updated daily on week days.
Initial download of the metrics may take a while.