Fig. 3
Download original image
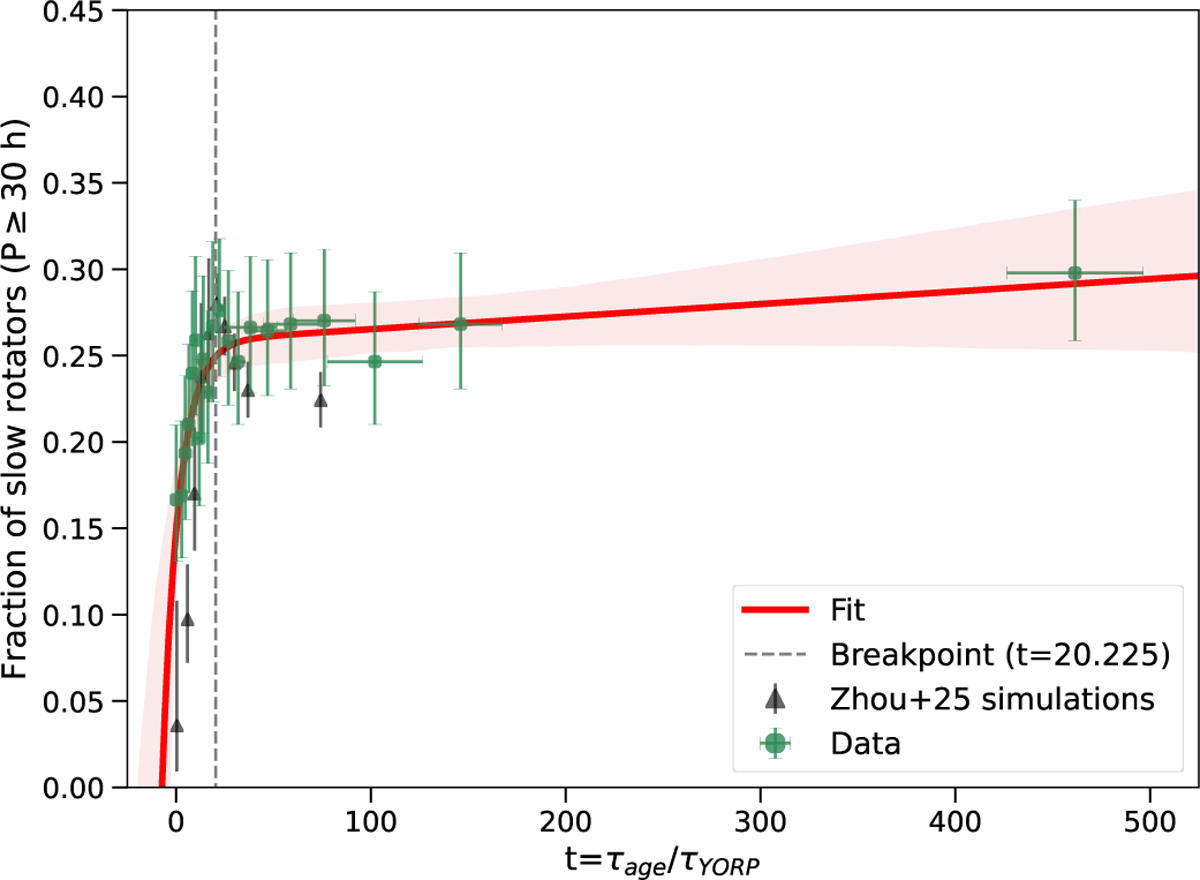
Fraction of slow rotators as a function of the dimensionless time t. The green points are the binned-collected observational data in this work. Black triangles are simulation data from the Zhou et al. (2025) model, where the YORP timescale is manually increased by ten times compared to the normal YORP timescale. The red line is the fit function in Eq. (5). The shaded area is the 95% confidence interval of the fit. We do not show individual families because data are not sufficient for a statistical analysis.
Current usage metrics show cumulative count of Article Views (full-text article views including HTML views, PDF and ePub downloads, according to the available data) and Abstracts Views on Vision4Press platform.
Data correspond to usage on the plateform after 2015. The current usage metrics is available 48-96 hours after online publication and is updated daily on week days.
Initial download of the metrics may take a while.