Fig. B.1.
Download original image
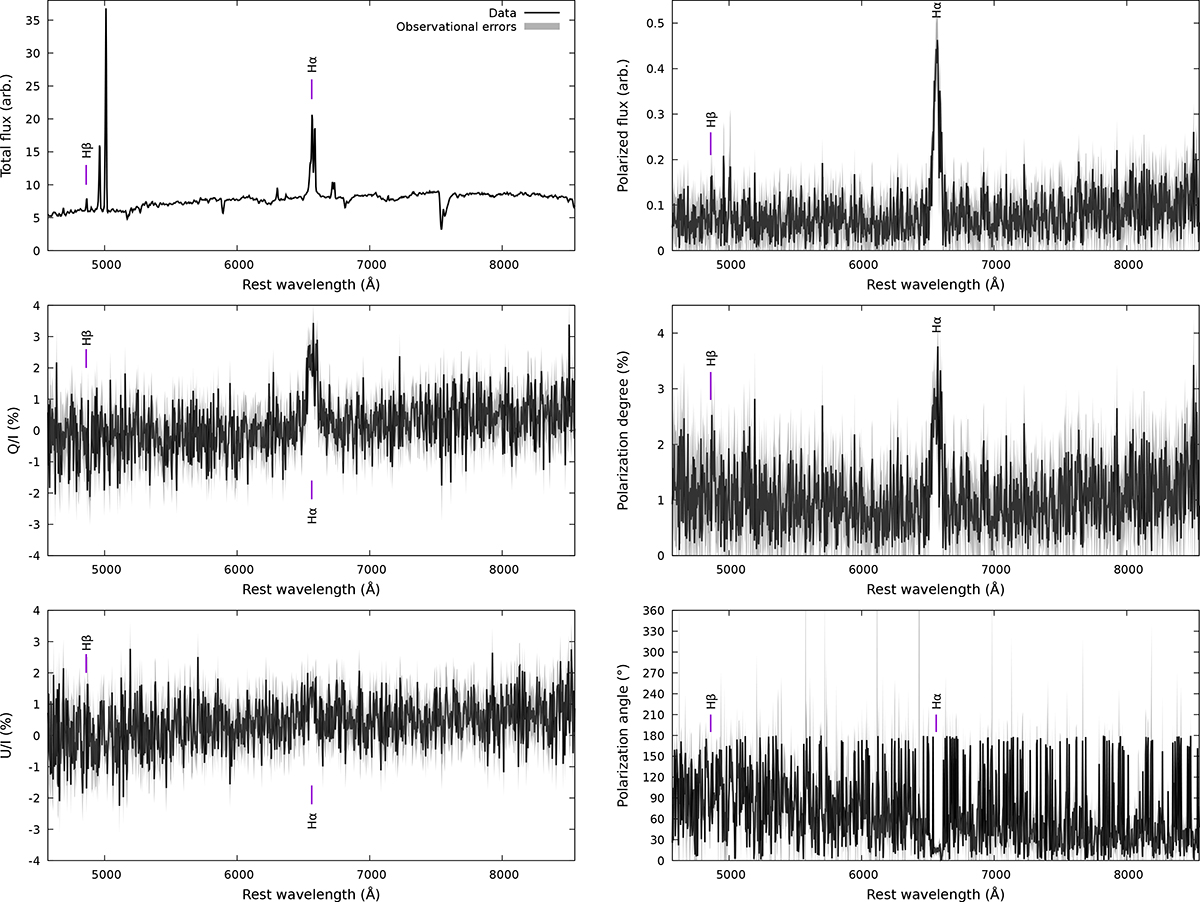
VLT/FORS2 spectropolarimetry of MCG-05-23-16. The top-left figure shows the total flux spectrum, corrected for the instrumental response (in arbitrary units). The middle- and bottom-left figures present the Q/I and U/I normalized Stokes parameters. The top-right panel shows the polarized flux, that is the multiplication of the total flux with the polarization degree. The middle-right panel presents the linear polarization degree while the bottom-right panel shows the polarization position angle. Spectra are shown at native spectral resolution. Observational errors are indicated in gray.
Current usage metrics show cumulative count of Article Views (full-text article views including HTML views, PDF and ePub downloads, according to the available data) and Abstracts Views on Vision4Press platform.
Data correspond to usage on the plateform after 2015. The current usage metrics is available 48-96 hours after online publication and is updated daily on week days.
Initial download of the metrics may take a while.