Fig. 7.
Download original image
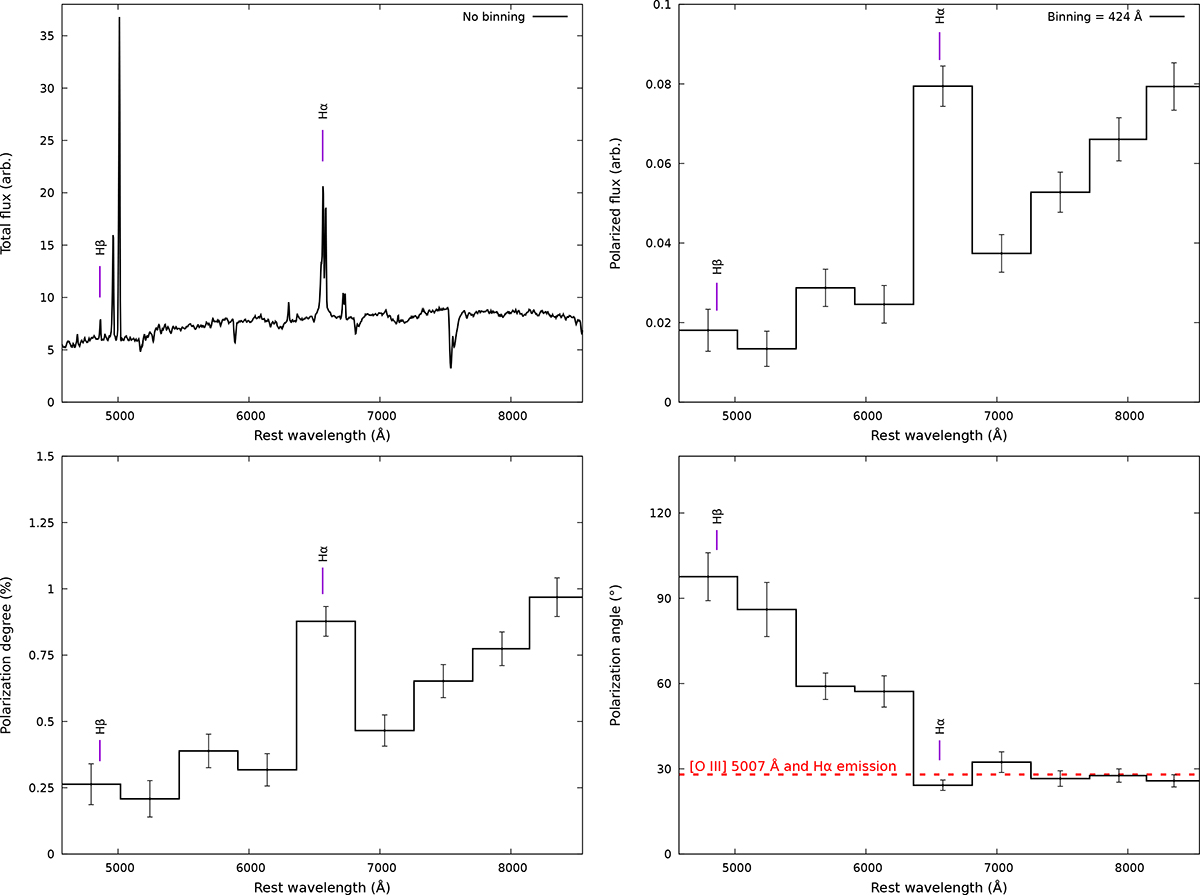
Spectropolarimetry of MCG-5-23-16 obtained with VLT/FORS2. Top-left panel: Total flux spectrum, corrected for the instrumental response (in arbitrary units). Top-right panel: Polarized flux, obtained by multiplying the total flux by the polarization degree. Bottom-left panel: Linear polarization degree. Bottom-right panel: Polarization position angle. Except for the total flux panel, spectra were rebinned to 137 consecutive pixels (424.8 Å) to achieve a polarization S/N of at least three per bin. Observational errors are shown for each spectral bin. The newly estimated position angle of the extended [O III] and Hα emission line region from (Ferruit et al. 2000) is indicated with a dashed red line in the polarization angle panel.
Current usage metrics show cumulative count of Article Views (full-text article views including HTML views, PDF and ePub downloads, according to the available data) and Abstracts Views on Vision4Press platform.
Data correspond to usage on the plateform after 2015. The current usage metrics is available 48-96 hours after online publication and is updated daily on week days.
Initial download of the metrics may take a while.