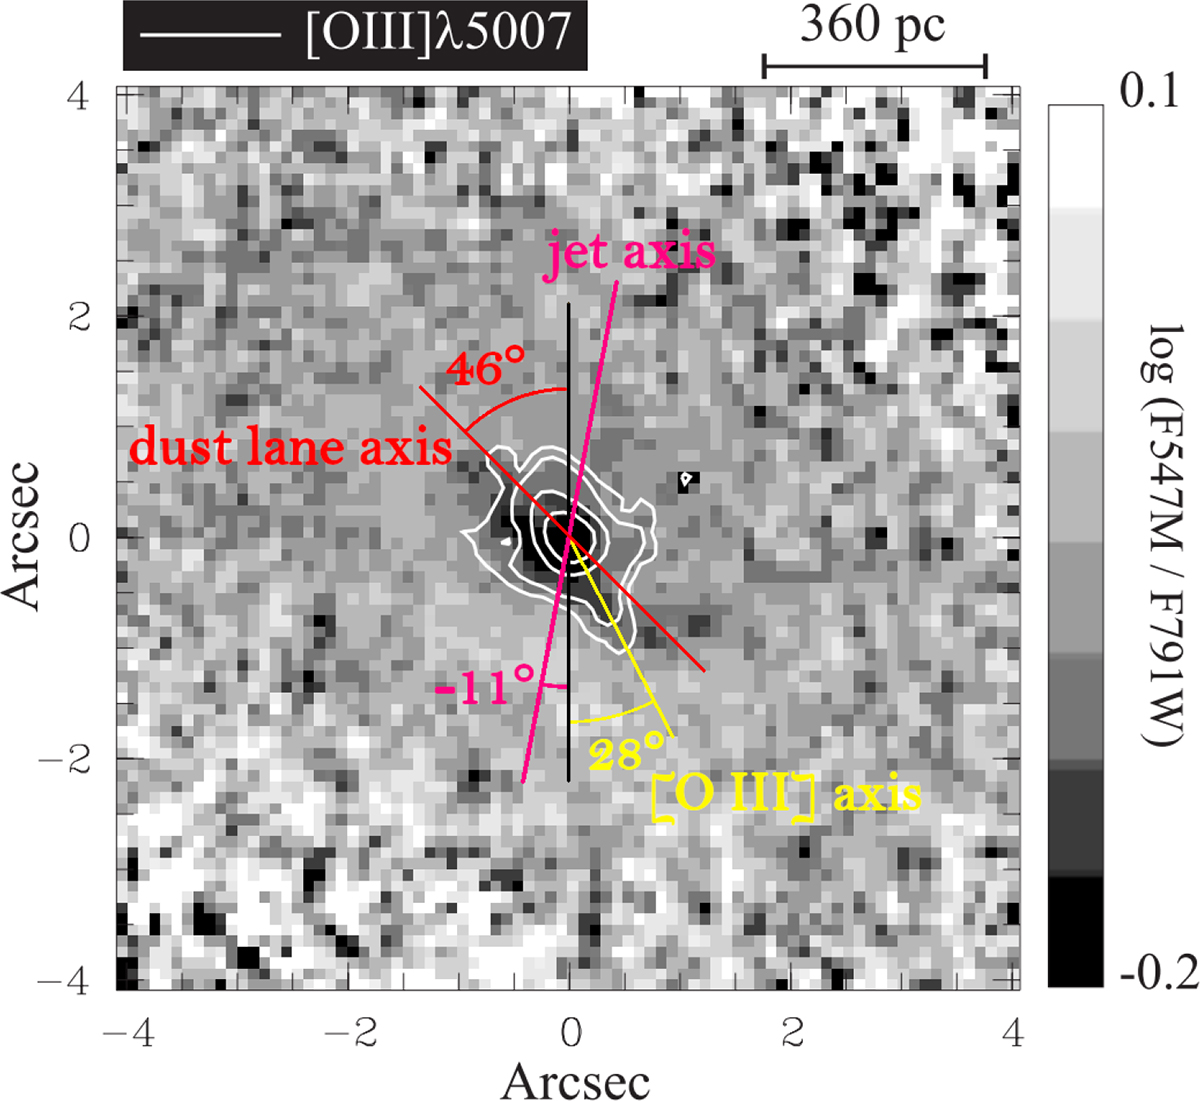
Fig. 9.
Download original image
Color map of MCG-5-23-16 from HST/WFPC2, extracted from Ferruit et al. (2000) (see their Fig. 8). North is up and east is to the left. The map was constructed by dividing the F547M continuum image by the F791W image and taking the logarithm. Darker regions (lower values of log (F547M/F791W)) correspond to redder areas. Selected isophotes (8, 16, 64, and 256 × 10−15 ergs s−1 cm−2 arcsec−2) of the [O III] λ5007 image are superposed on the image. The gray scales are linear and the pixel size is 0.0996 arcsec−2. The pink line indicates the position angle of the radio-jet axis, marginally measured by Mundell et al. (2009) and Orienti & Prieto (2010), traced on top of the image from Ferruit et al. (2000). The red line shows our measured position angle of the dust lane extracted from Prieto et al. (2014). The yellow line marks our new estimation of the position angle of the maximal extension of the [O III] λ5007 emission.
Current usage metrics show cumulative count of Article Views (full-text article views including HTML views, PDF and ePub downloads, according to the available data) and Abstracts Views on Vision4Press platform.
Data correspond to usage on the plateform after 2015. The current usage metrics is available 48-96 hours after online publication and is updated daily on week days.
Initial download of the metrics may take a while.