Open Access
Fig. A.2
Download original image
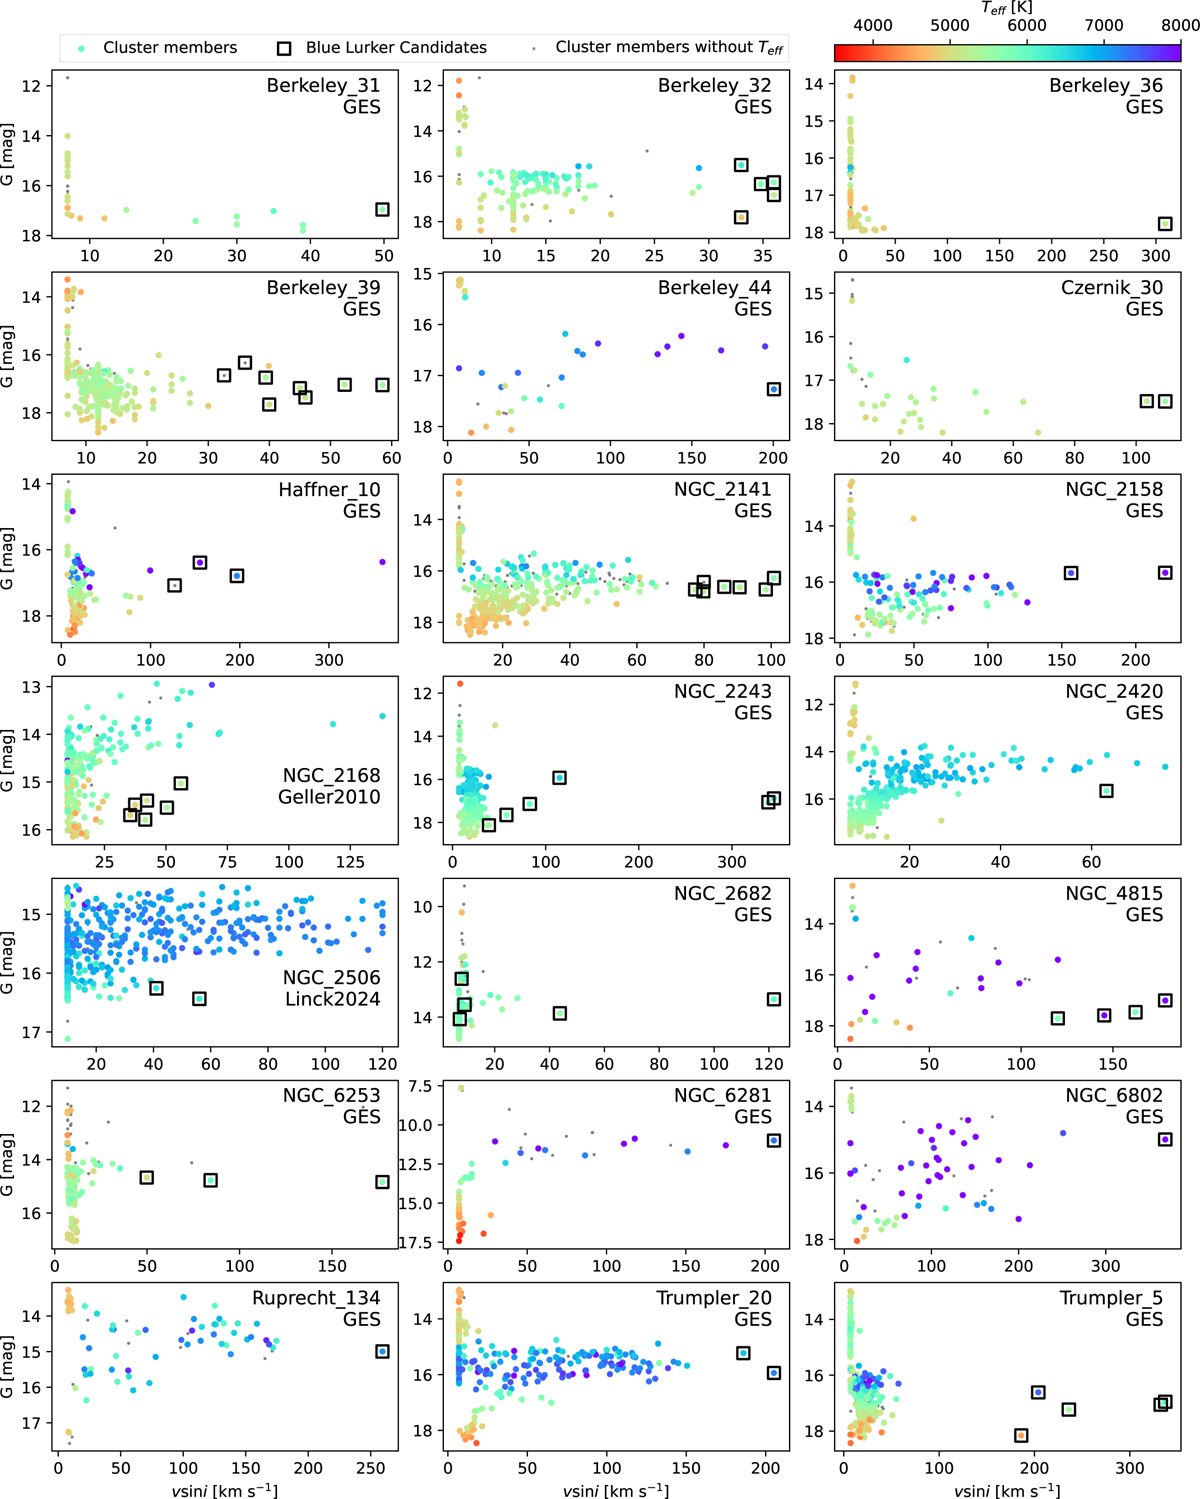
Distribution of the v sin i and Gaia G magnitudes for clusters analyzed with spectroscopy. The stars are colored by their temperature (if unavailable, the stars are shown as gray dots). The BL candidates are highlighted by the black squares.
Current usage metrics show cumulative count of Article Views (full-text article views including HTML views, PDF and ePub downloads, according to the available data) and Abstracts Views on Vision4Press platform.
Data correspond to usage on the plateform after 2015. The current usage metrics is available 48-96 hours after online publication and is updated daily on week days.
Initial download of the metrics may take a while.