Open Access
Fig. A.3
Download original image
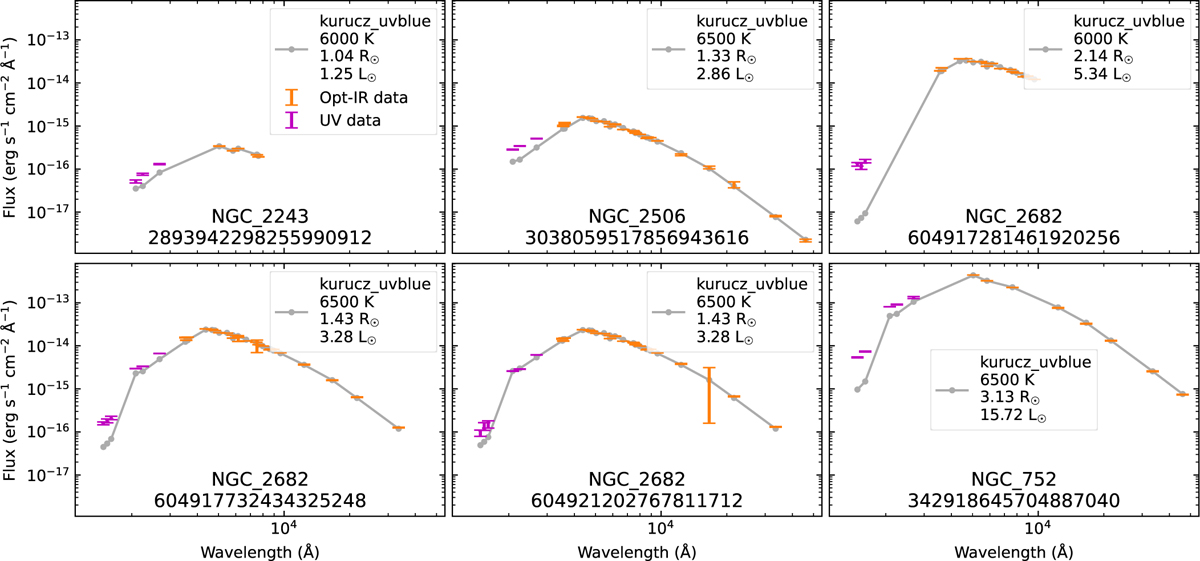
Spectral energy distributions of stars with significant excess flux in at least three UV filters. The UV (magenta) and optical-IR fluxes (orange) are shown using the corresponding flux errors. The best-fit Kurucz-UVBLUE model is shown in gray.
Current usage metrics show cumulative count of Article Views (full-text article views including HTML views, PDF and ePub downloads, according to the available data) and Abstracts Views on Vision4Press platform.
Data correspond to usage on the plateform after 2015. The current usage metrics is available 48-96 hours after online publication and is updated daily on week days.
Initial download of the metrics may take a while.