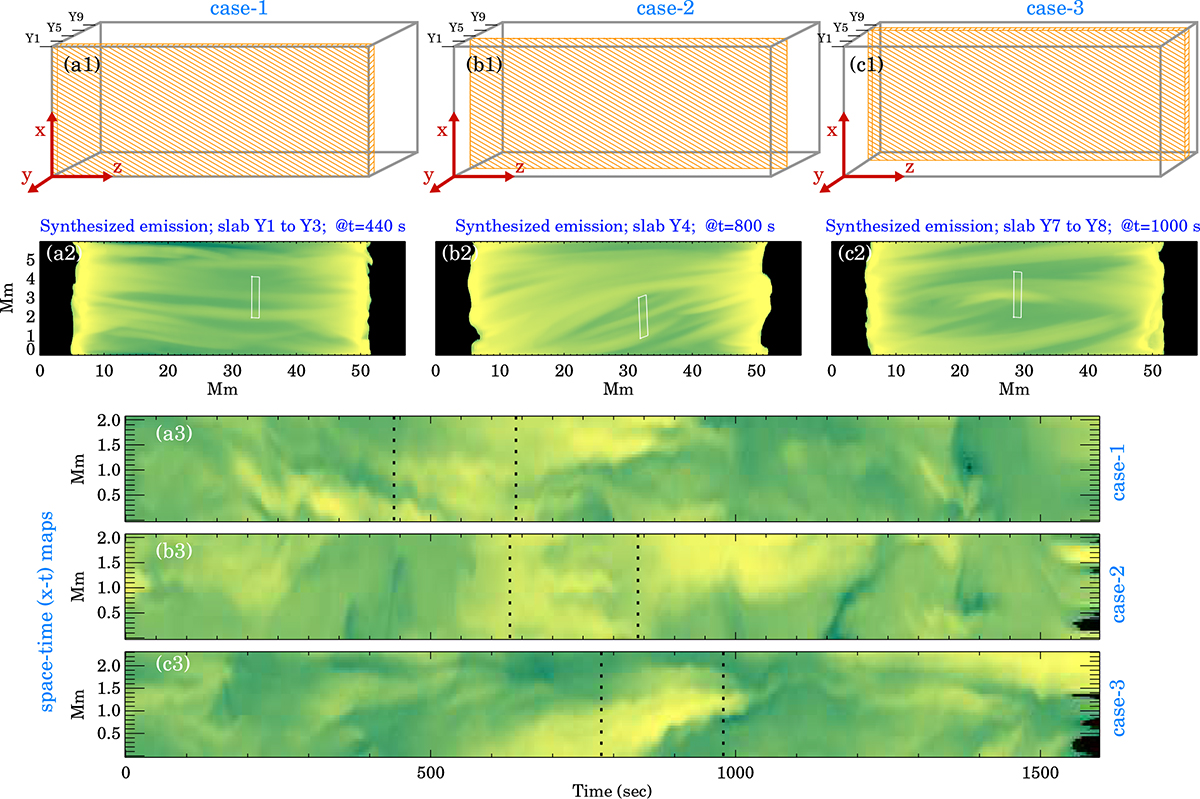
Fig. 1.
Download original image
Overview of the x − t maps generated from the synthetic 171 Å image sequence. Panel a1 illustrates the schematic of the simulation domain, where the orange hatched area outlines the volume we used to generate the synthetic image of case 1, shown in panel a2. The rectangular white box in panel a2 indicates the location and extent of the artificial slit we used to create the space-time (x − t) map displayed in panel a3. The two vertical lines in this x − t map define the time window during which decayless oscillations are observed. Cases 2 and 3 are presented in panels b1 to b3 and c1 to c3, respectively.
Current usage metrics show cumulative count of Article Views (full-text article views including HTML views, PDF and ePub downloads, according to the available data) and Abstracts Views on Vision4Press platform.
Data correspond to usage on the plateform after 2015. The current usage metrics is available 48-96 hours after online publication and is updated daily on week days.
Initial download of the metrics may take a while.