Fig. 2.
Download original image
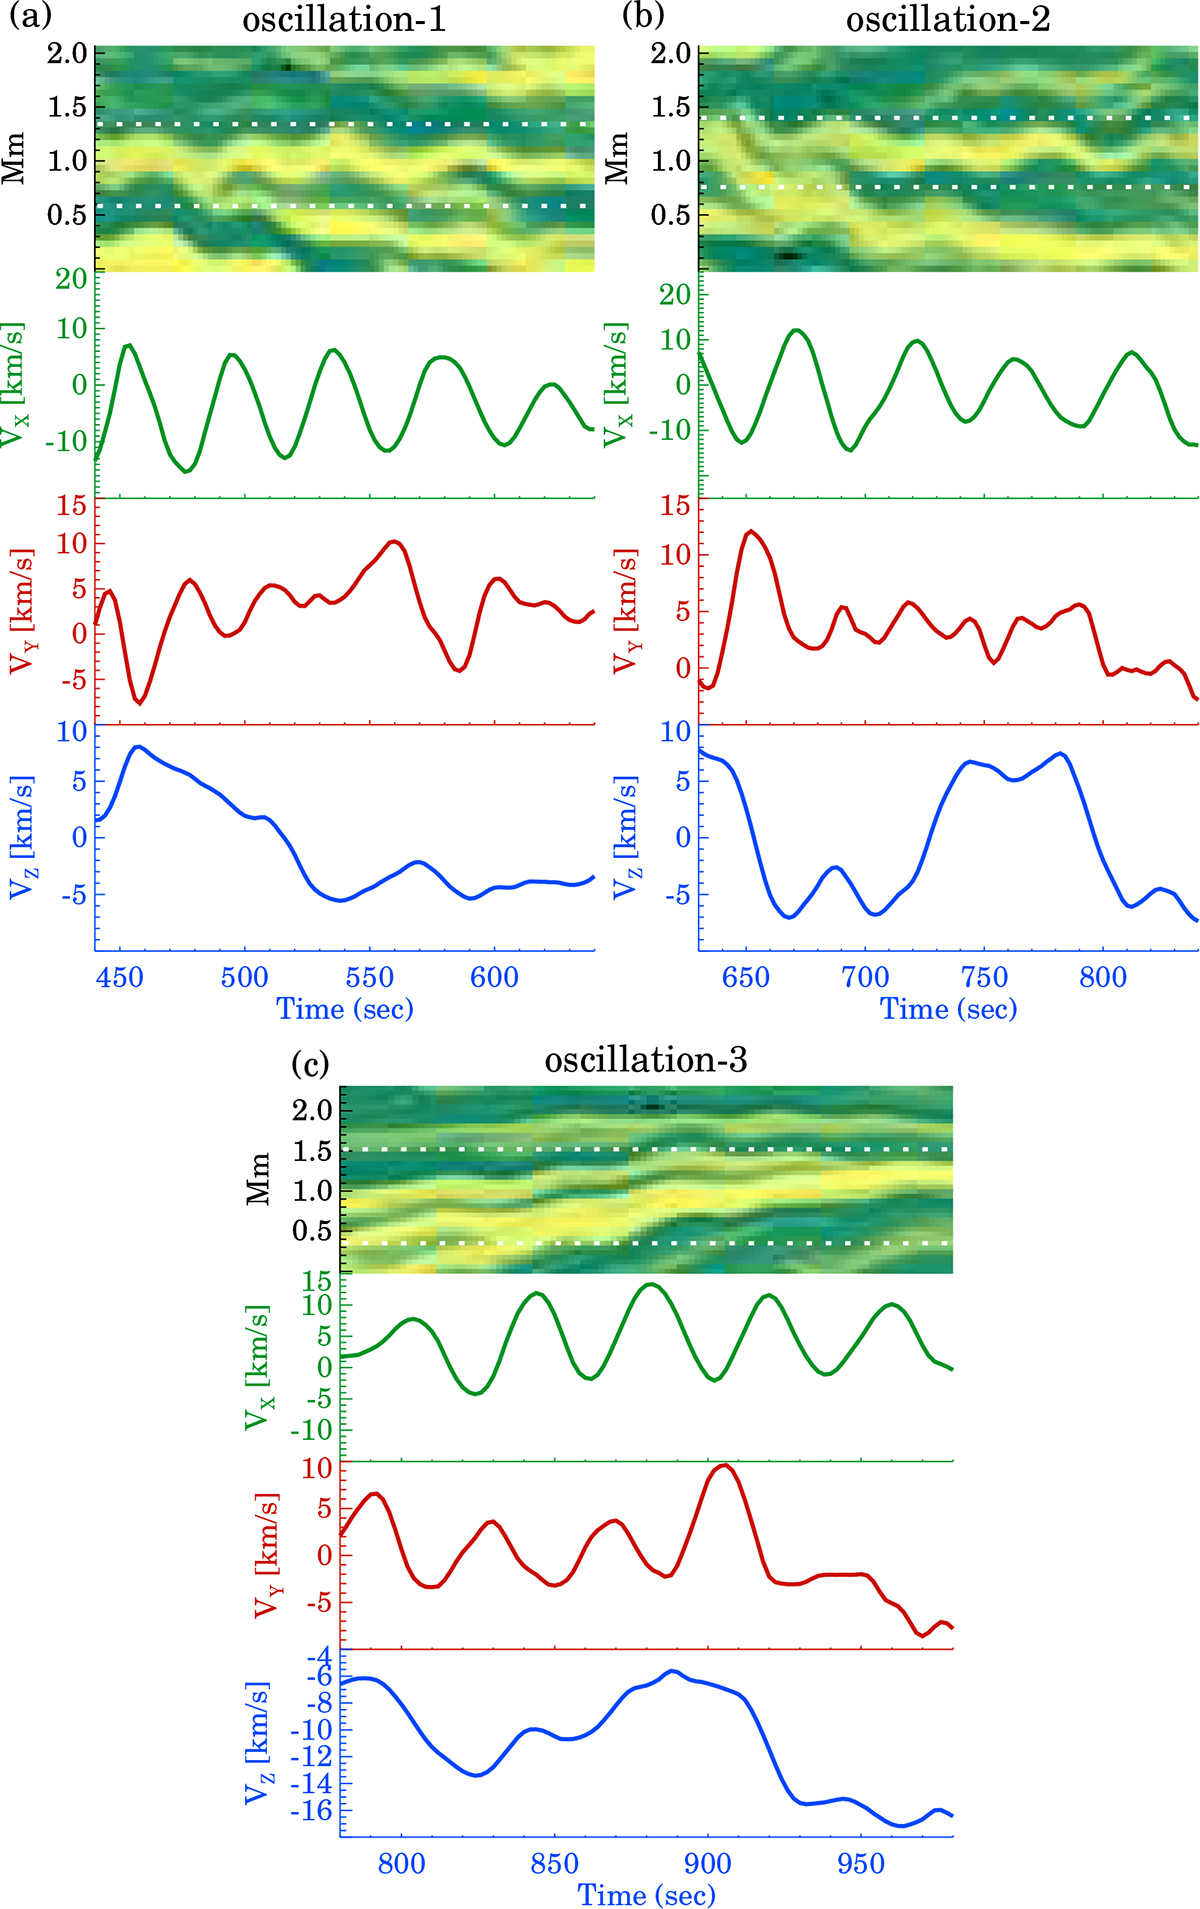
Signatures of decayless oscillations in emission x − t maps and in the velocity components. Panel a presents signatures of oscillation-1 (from case-1). The top row in this panel displays a zoomed-in x − t map from Fig. 1, and the next three rows illustrate the time evolution of the velocity components vx, vy, and vz, respectively. The horizontal white lines indicate the δx extent of the 3D volume from which the velocity components were obtained (see Sect. 4.1 for more details). The other two panels (b and c) present information for oscillations 2 and 3 in the same format.
Current usage metrics show cumulative count of Article Views (full-text article views including HTML views, PDF and ePub downloads, according to the available data) and Abstracts Views on Vision4Press platform.
Data correspond to usage on the plateform after 2015. The current usage metrics is available 48-96 hours after online publication and is updated daily on week days.
Initial download of the metrics may take a while.