Fig. A.1.
Download original image
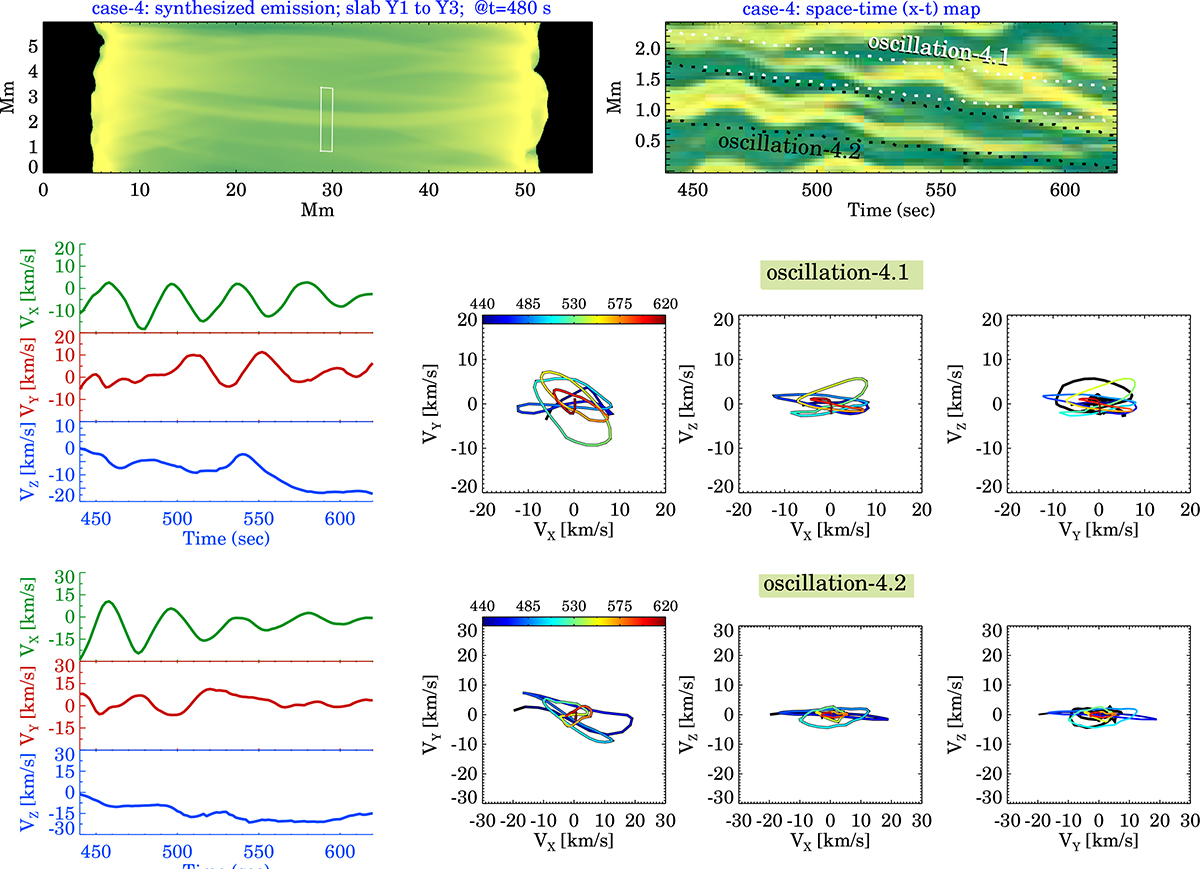
An example of co-existing decaying and decayless kink oscillations in neighboring loops. Top row shows the synthetic 171 Å image with the white rectangular box outlining the position of the artificial slit used to generate the x-t map shown in next panel. The slanted white and black dotted lines mark the δx values for the two selected oscillations. For more information on this, see Sect 4.1. The middle row displays the vx, vy and vz curves and the hodograms constructed for oscillation-4.1. The same but for oscillation-4.2 is shown in the bottom row panels. An animated version is available online.
Current usage metrics show cumulative count of Article Views (full-text article views including HTML views, PDF and ePub downloads, according to the available data) and Abstracts Views on Vision4Press platform.
Data correspond to usage on the plateform after 2015. The current usage metrics is available 48-96 hours after online publication and is updated daily on week days.
Initial download of the metrics may take a while.