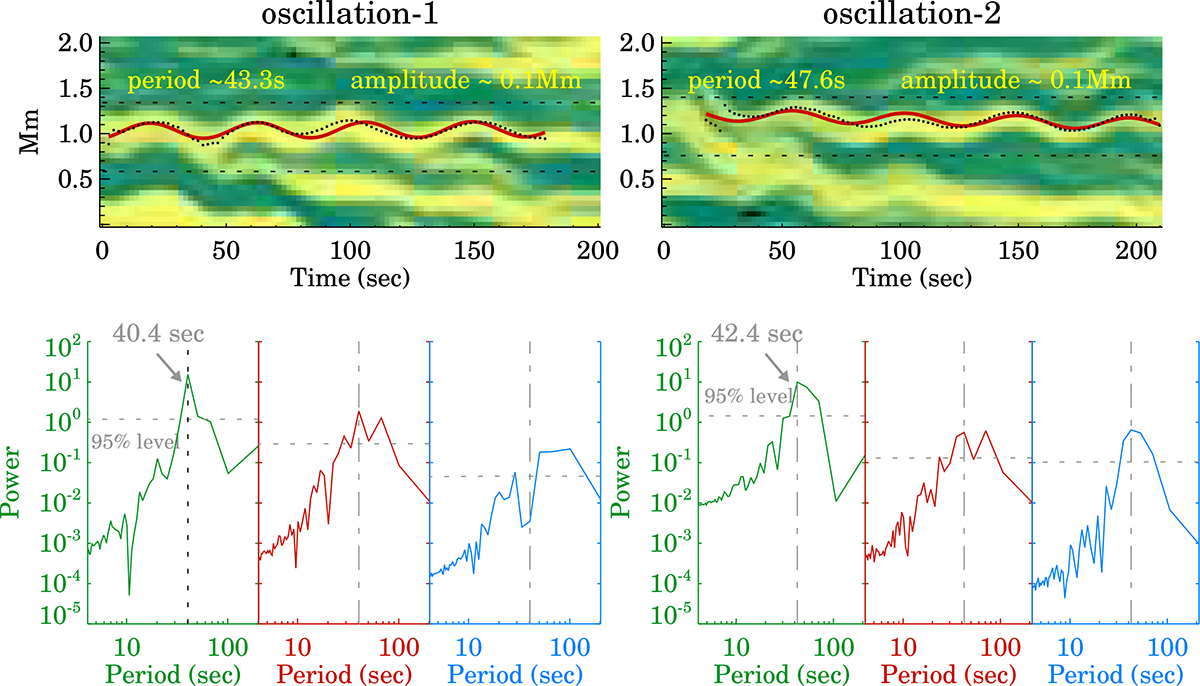
Fig. B.2.
Download original image
Estimation of oscillation periods based on the x-t maps and the velocity components. The top row of panels displays the x-t maps for oscillation-1 and oscillation-2. In these maps, dotted circles indicate the locations of the centers of the oscillating threads, while solid red curves represent the best-fit function (B.1) to those points. The estimated periods and amplitudes are shown on the panels. The bottom row of panels presents the FFT power spectrum for each velocity component: vx in green, vy in red, and vz in blue. The vertical dotted lines in these panels mark the locations of the dominant periods of vx, while the horizontal dashed lines outline the 95% significance level.
Current usage metrics show cumulative count of Article Views (full-text article views including HTML views, PDF and ePub downloads, according to the available data) and Abstracts Views on Vision4Press platform.
Data correspond to usage on the plateform after 2015. The current usage metrics is available 48-96 hours after online publication and is updated daily on week days.
Initial download of the metrics may take a while.