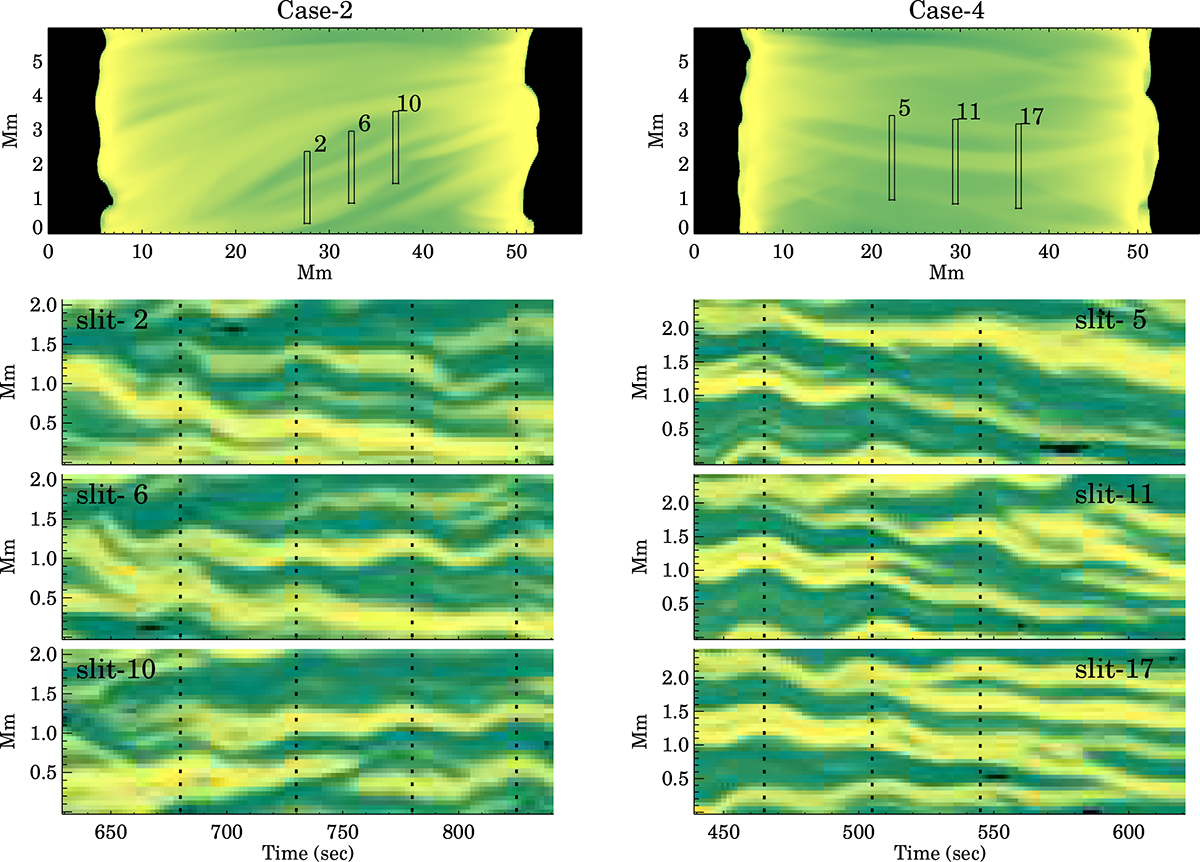
Fig. C.1.
Download original image
Identification of the wave mode through x-t maps. The left column shows the emission map (top panel) followed by x-t maps derived from the three slits indicated in the white rectangular boxes on the emission map. The dotted vertical lines mark the locations of the wave peaks and serve as a visual guide to identify the similarities or dissimilarities between oscillations. A similar analysis for case 4 is presented in the panels of the second column.
Current usage metrics show cumulative count of Article Views (full-text article views including HTML views, PDF and ePub downloads, according to the available data) and Abstracts Views on Vision4Press platform.
Data correspond to usage on the plateform after 2015. The current usage metrics is available 48-96 hours after online publication and is updated daily on week days.
Initial download of the metrics may take a while.