Fig. 1
Download original image
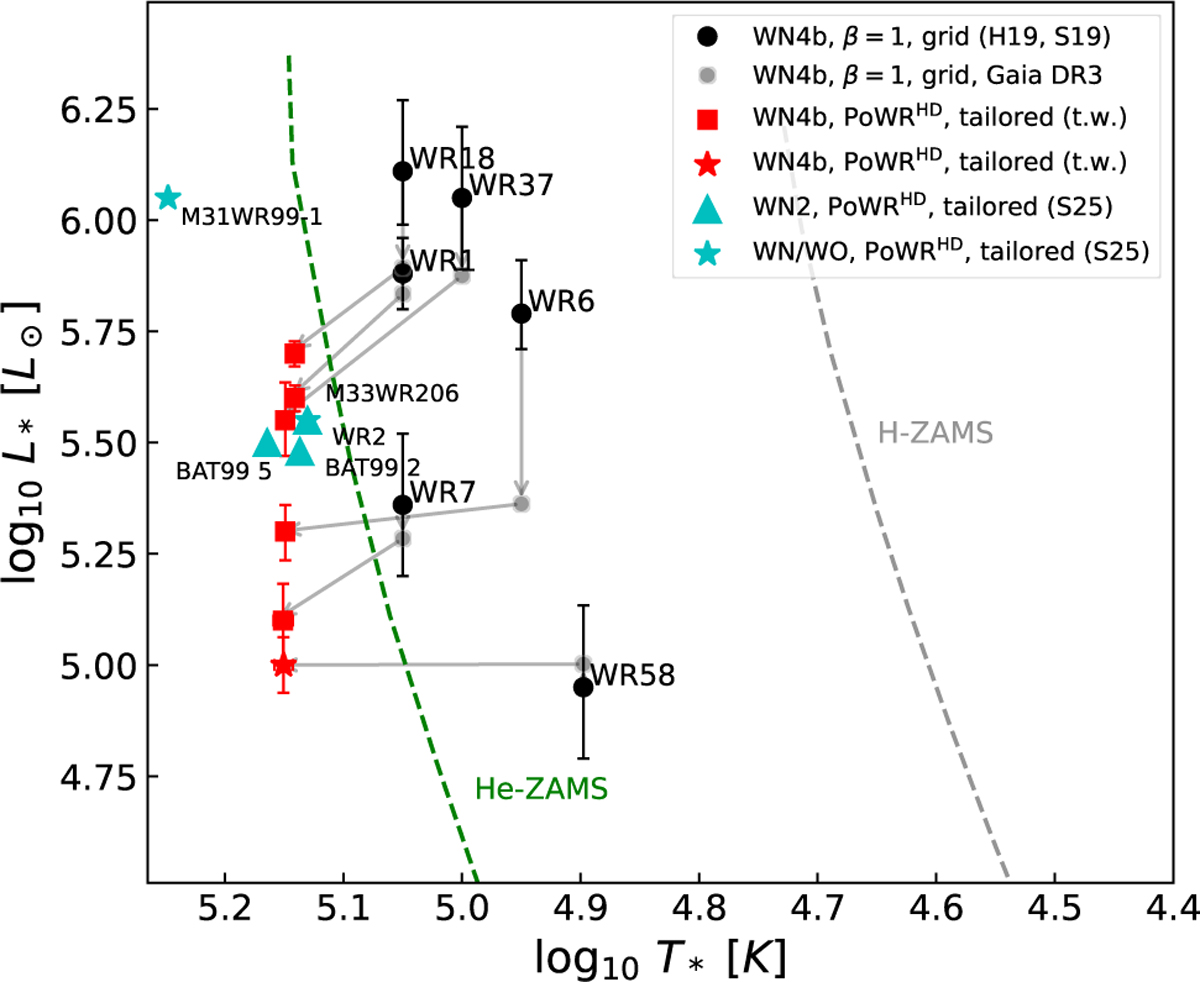
HR diagram of the WN4b sample with parameters from H19 and S19 (black circles), updated parameters using only corrected parallaxes from Gaia DR3 (grey circles), and parameters from modelling with PoWRHD in this work (red). Gaia DR3 corrections are depicted by arrows from black circles to grey circles. Differences in addition to the distance corrections are illustrated with grey arrows from the grey circles to the red data points. For comparison, we also show the stars from S25 (cyan) as well as the H-ZAMS from Ekström et al. (2012) and the He-ZAMS from Langer (1989) as the grey and green dashed lines, respectively.
Current usage metrics show cumulative count of Article Views (full-text article views including HTML views, PDF and ePub downloads, according to the available data) and Abstracts Views on Vision4Press platform.
Data correspond to usage on the plateform after 2015. The current usage metrics is available 48-96 hours after online publication and is updated daily on week days.
Initial download of the metrics may take a while.