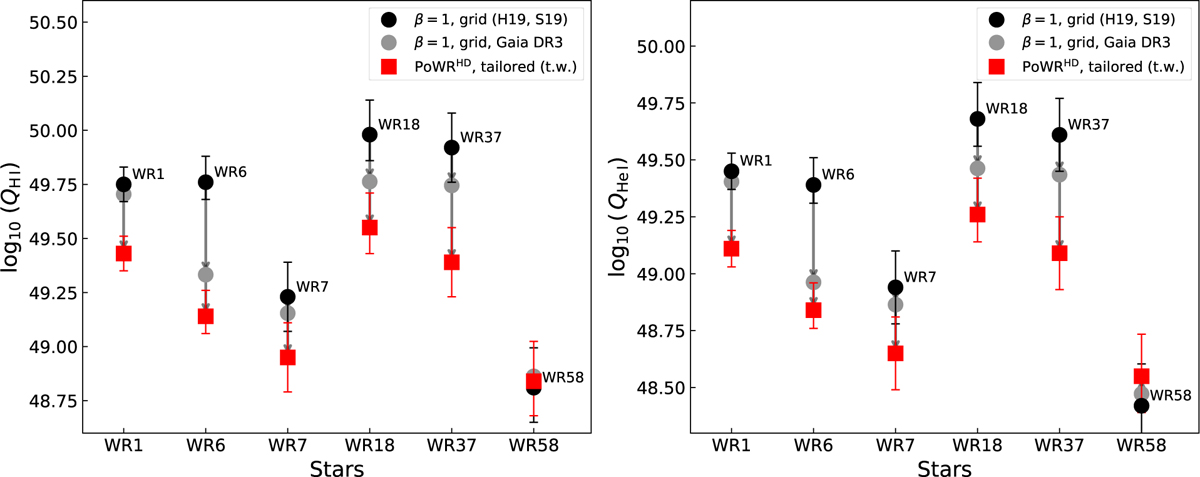
Fig. A.1
Download original image
Amount of ionising photons for HI (QHI, left panel) and for He I (QHI, right panel) in the case of the β = 1 grid models (H19 & S19, black circles) and the PoWRHD models (red squares). Similar to Figs. 1, 2, and 5, a correction for GAIA DR3 parallaxes (grey circles) was made in order to separate the effects of distance updates and model differences, denoted by the grey arrows.
Current usage metrics show cumulative count of Article Views (full-text article views including HTML views, PDF and ePub downloads, according to the available data) and Abstracts Views on Vision4Press platform.
Data correspond to usage on the plateform after 2015. The current usage metrics is available 48-96 hours after online publication and is updated daily on week days.
Initial download of the metrics may take a while.