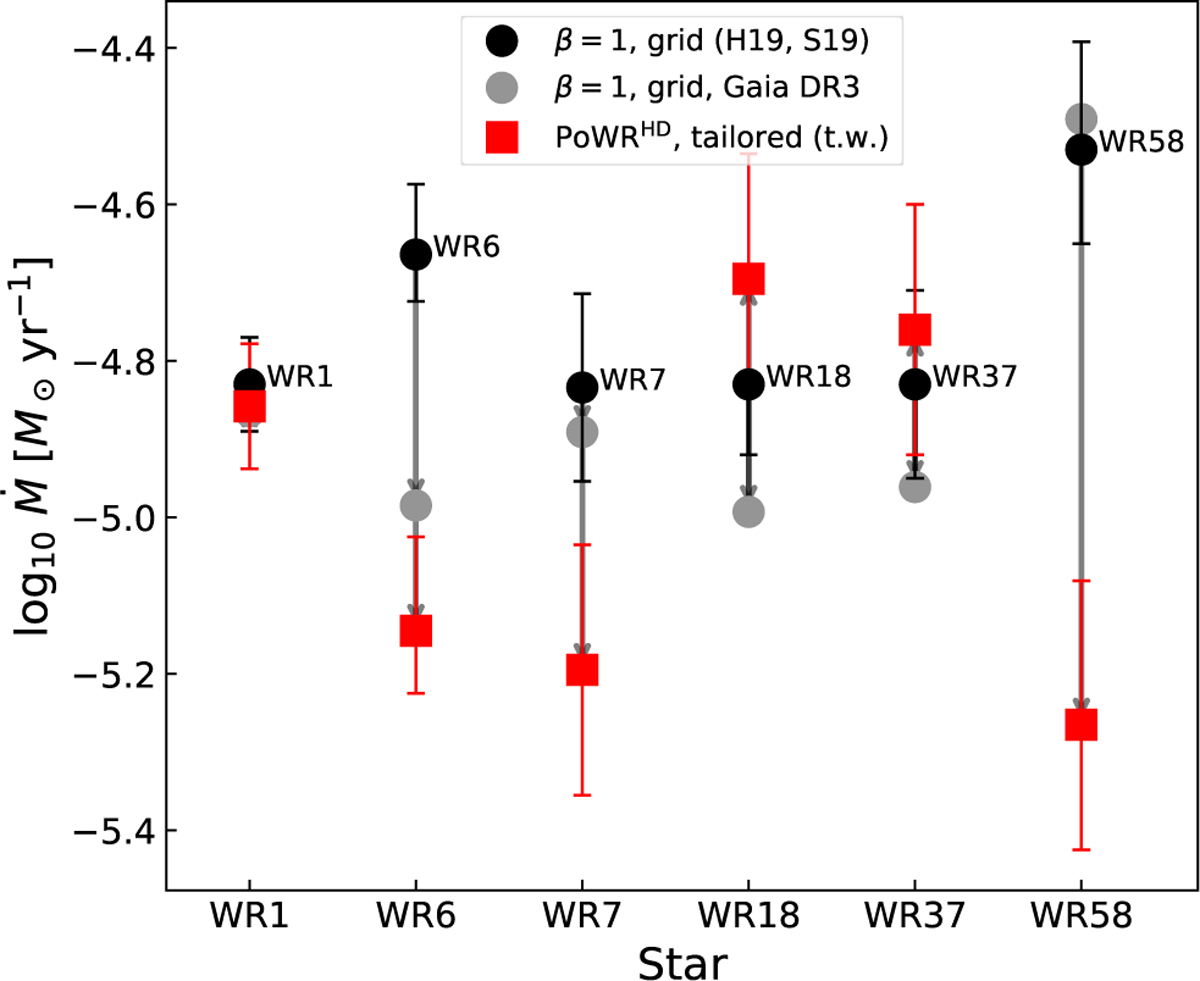
Fig. 5
Download original image
Mass-loss rate Ṁ comparison between the WN4b β = 1 grid models (H19 & S19, black circles) and the PoWRHD models in this work (red squares). As in Figs. 1 and 2, the Gaia DR3 distance correction is applied on the grid models (grey circles) separate from the Ṁ updates in this work (see Sect. 3.3). The two-step parameter difference is denoted with the grey arrows per target.
Current usage metrics show cumulative count of Article Views (full-text article views including HTML views, PDF and ePub downloads, according to the available data) and Abstracts Views on Vision4Press platform.
Data correspond to usage on the plateform after 2015. The current usage metrics is available 48-96 hours after online publication and is updated daily on week days.
Initial download of the metrics may take a while.