Fig. 6
Download original image
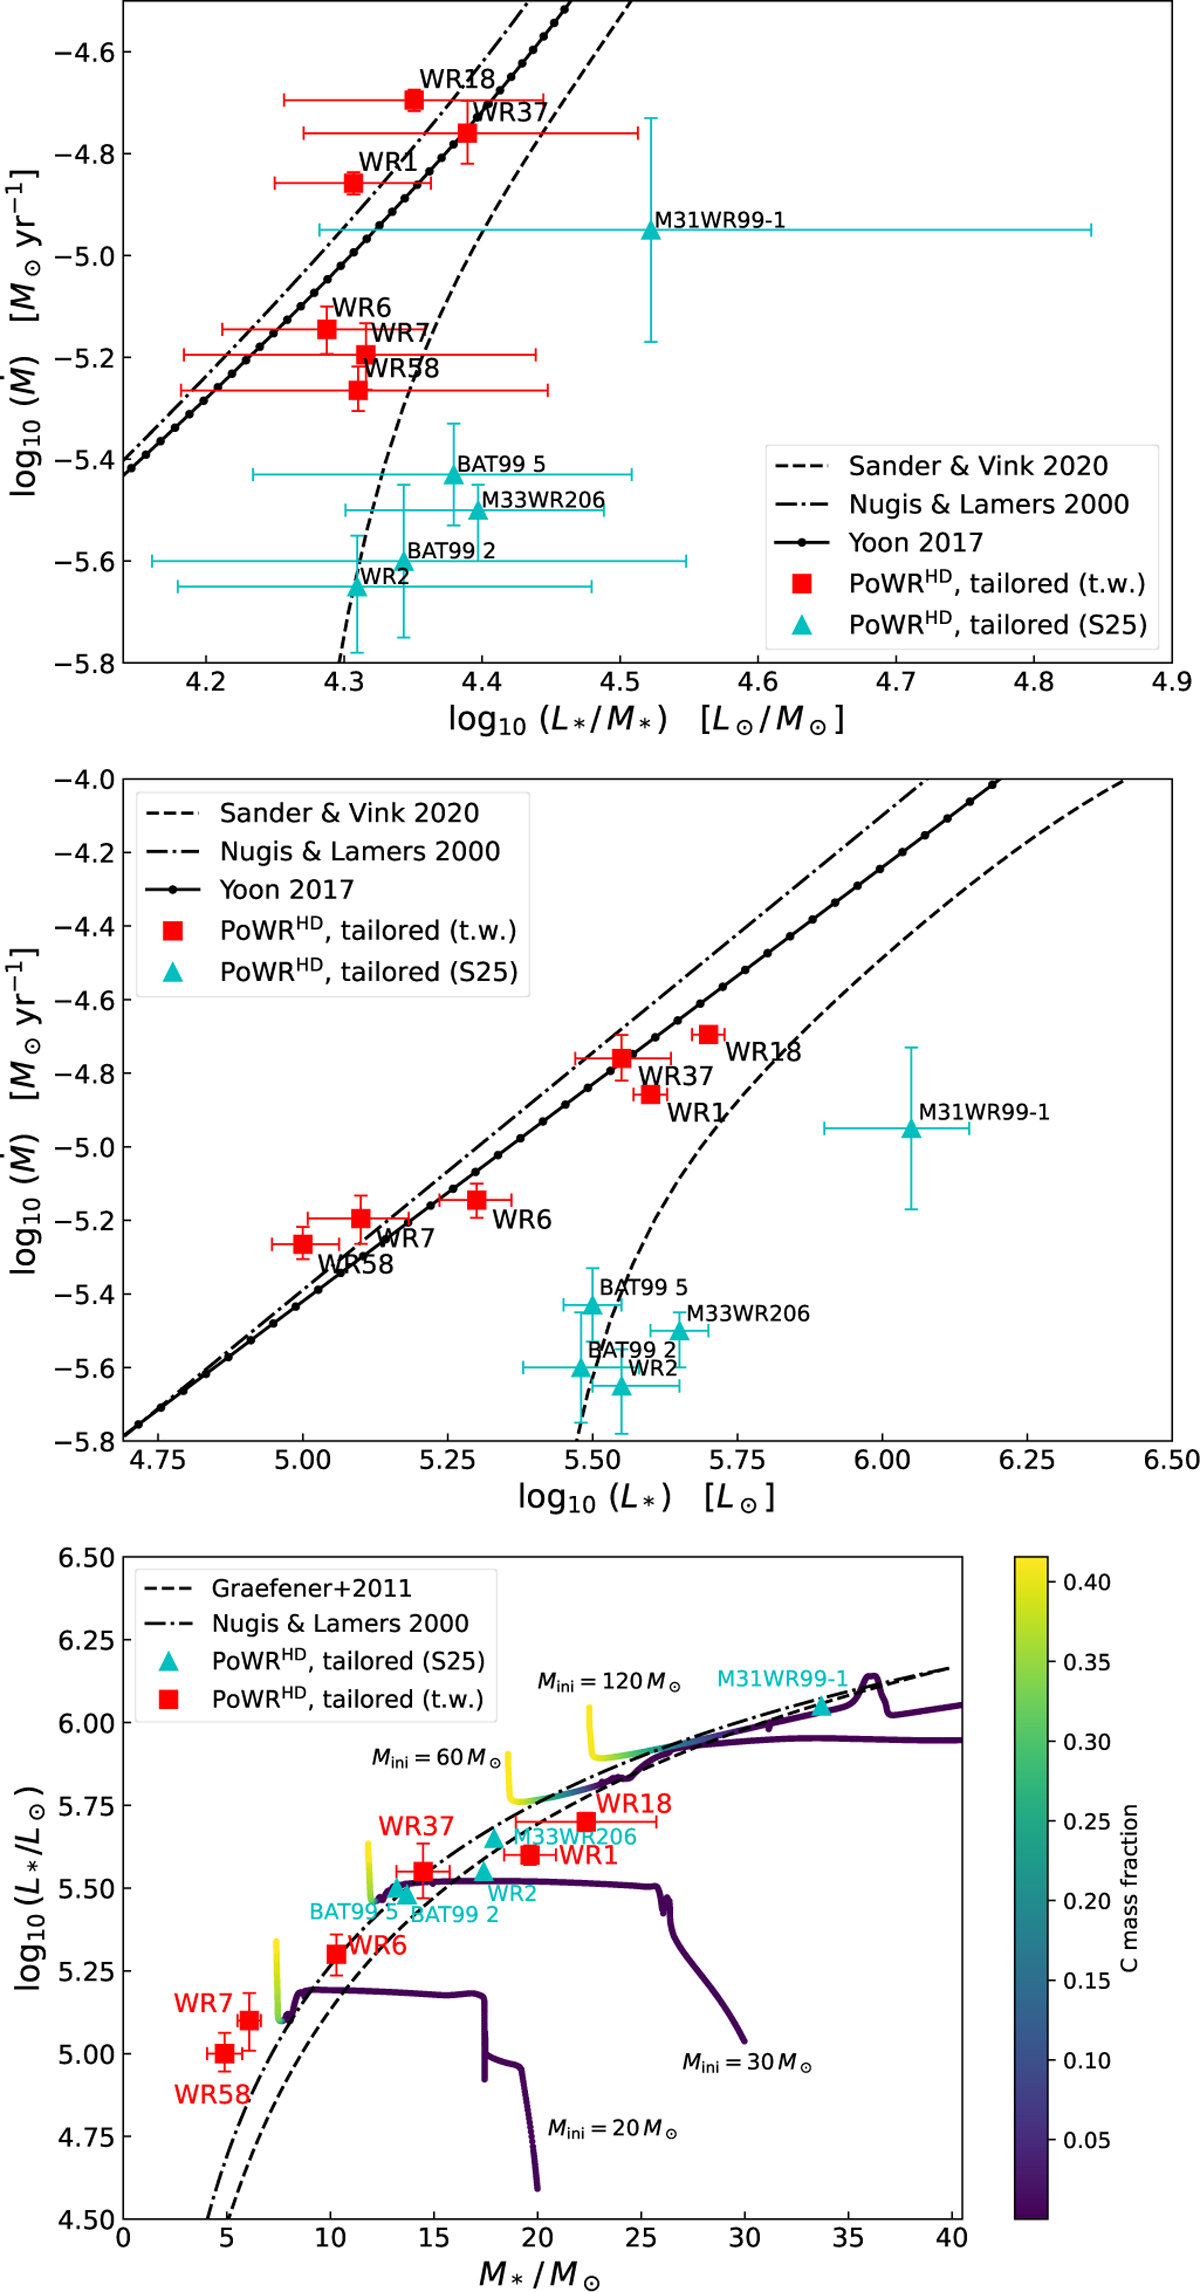
Top panel: Ṁ values of the PoWRHD WN4b models in this work (red squares) and the S25 targets (cyan triangles) in terms of L*/M*. For comparison, the Ṁ laws from Nugis & Lamers (2000), Yoon (2017) and Sander & Vink (2020) are displayed. Middle panel: same Ṁ values, but in terms of L* and compared with the same predictions as in the top panel. Bottom panel: model L* values in terms of M*. The L* ~ M* relations from Nugis & Lamers (2000) and Gräfener et al. (2011) are shown as well, along with the evolutionary tracks (with rotation) from Chieffi & Limongi (2013) for initial masses 20, 30, 60, and 120 M⊙. The evolutionary tracks are colour-coded by carbon surface abundances in mass fractions.
Current usage metrics show cumulative count of Article Views (full-text article views including HTML views, PDF and ePub downloads, according to the available data) and Abstracts Views on Vision4Press platform.
Data correspond to usage on the plateform after 2015. The current usage metrics is available 48-96 hours after online publication and is updated daily on week days.
Initial download of the metrics may take a while.