Open Access
Fig. 8
Download original image
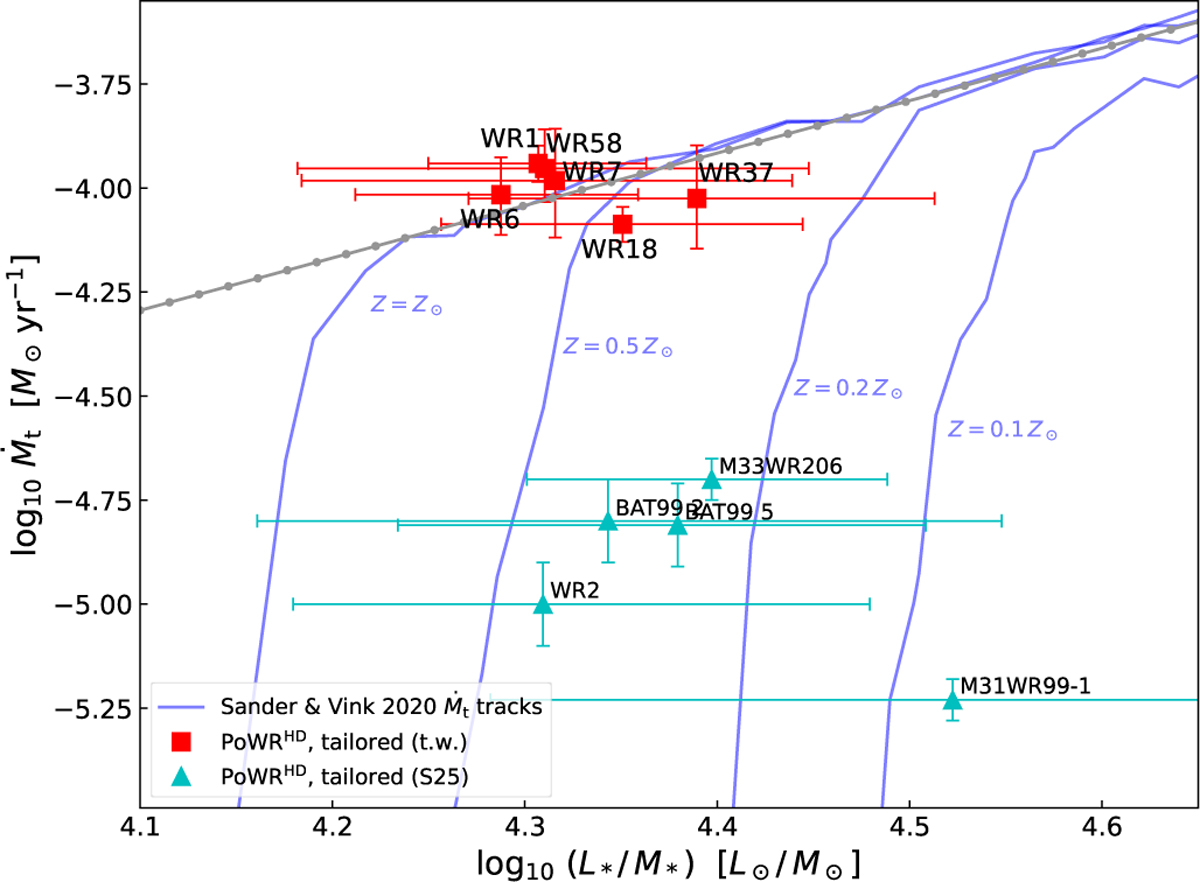
Comparison of the WN4b PoWRHD models in this work (red squares), the S25 models (cyan triangles) in Ṁt-L*/M* space. In blue are the Ṁt tracks from Sander & Vink (2020) depicted for Z = 0.1, 0.2, 0.5 Z⊙ and Z = Z⊙. The thick gray dotted line indicates the fit in the dense-wind regime derived in Sander & Vink (2020).
Current usage metrics show cumulative count of Article Views (full-text article views including HTML views, PDF and ePub downloads, according to the available data) and Abstracts Views on Vision4Press platform.
Data correspond to usage on the plateform after 2015. The current usage metrics is available 48-96 hours after online publication and is updated daily on week days.
Initial download of the metrics may take a while.