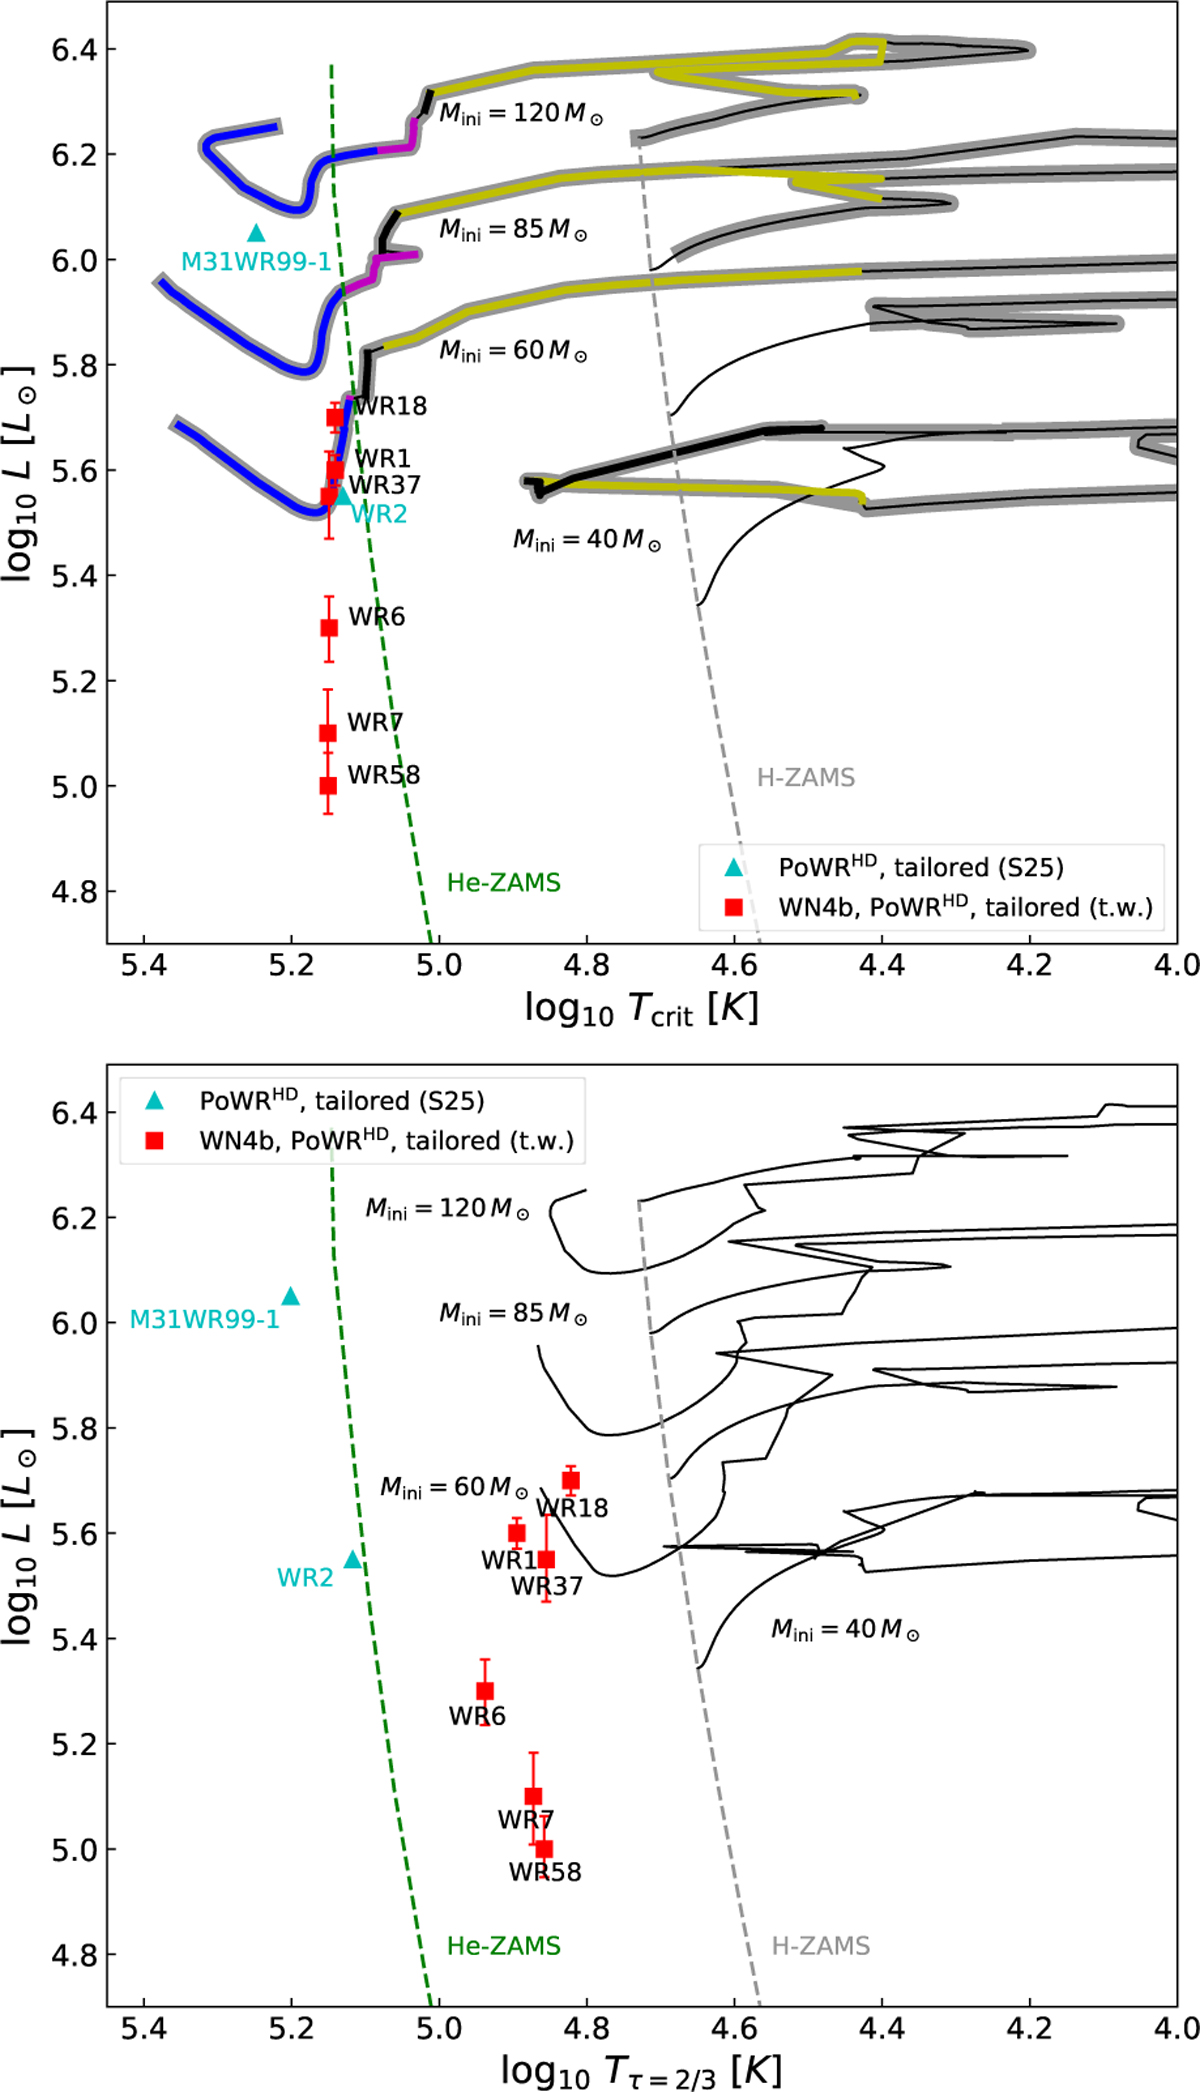
Fig. 9
Download original image
HRD of the PoWRHD WN4b models (red squares), with the effective temperatures at the critical radius Tcrit (top panel). The GENEC evolutionary tracks without initial rotation from Ekström et al. (2012) with Mini = 40, 60, 85, and 120 M⊙ are shown, where we display effective temperatures not corrected for the wind. Separate segments of the evolutionary tracks are colour-coded by surface abundance: bold yellow denotes WNh stars (0.4 > XH > 0.02); bold black denotes WN stars (XH < 0.02); bold magenta denotes WN/WC stars (XC > 0.02); and bold blue denotes WC or WO stars (XC > 0.2). The tracks are further indicated in bold grey according to the criterion τ(R*) > 1.45 from Aguilera-Dena et al. (2022) (see also Eq. (4)). For comparison, the PoWRHD models of M31WR99-1 and WR2 from S25 are shown as well. The bottom panel shows the same PoWRHD models, but now comparing the wind-corrected temperatures given by GENEC with the determined T2/3 temperatures at τ = 2/3. In both panels the H-ZAMS from Ekström et al. (2012) and the He-ZAMS from Langer (1989) are shown as the grey and green dashed lines, respectively.
Current usage metrics show cumulative count of Article Views (full-text article views including HTML views, PDF and ePub downloads, according to the available data) and Abstracts Views on Vision4Press platform.
Data correspond to usage on the plateform after 2015. The current usage metrics is available 48-96 hours after online publication and is updated daily on week days.
Initial download of the metrics may take a while.