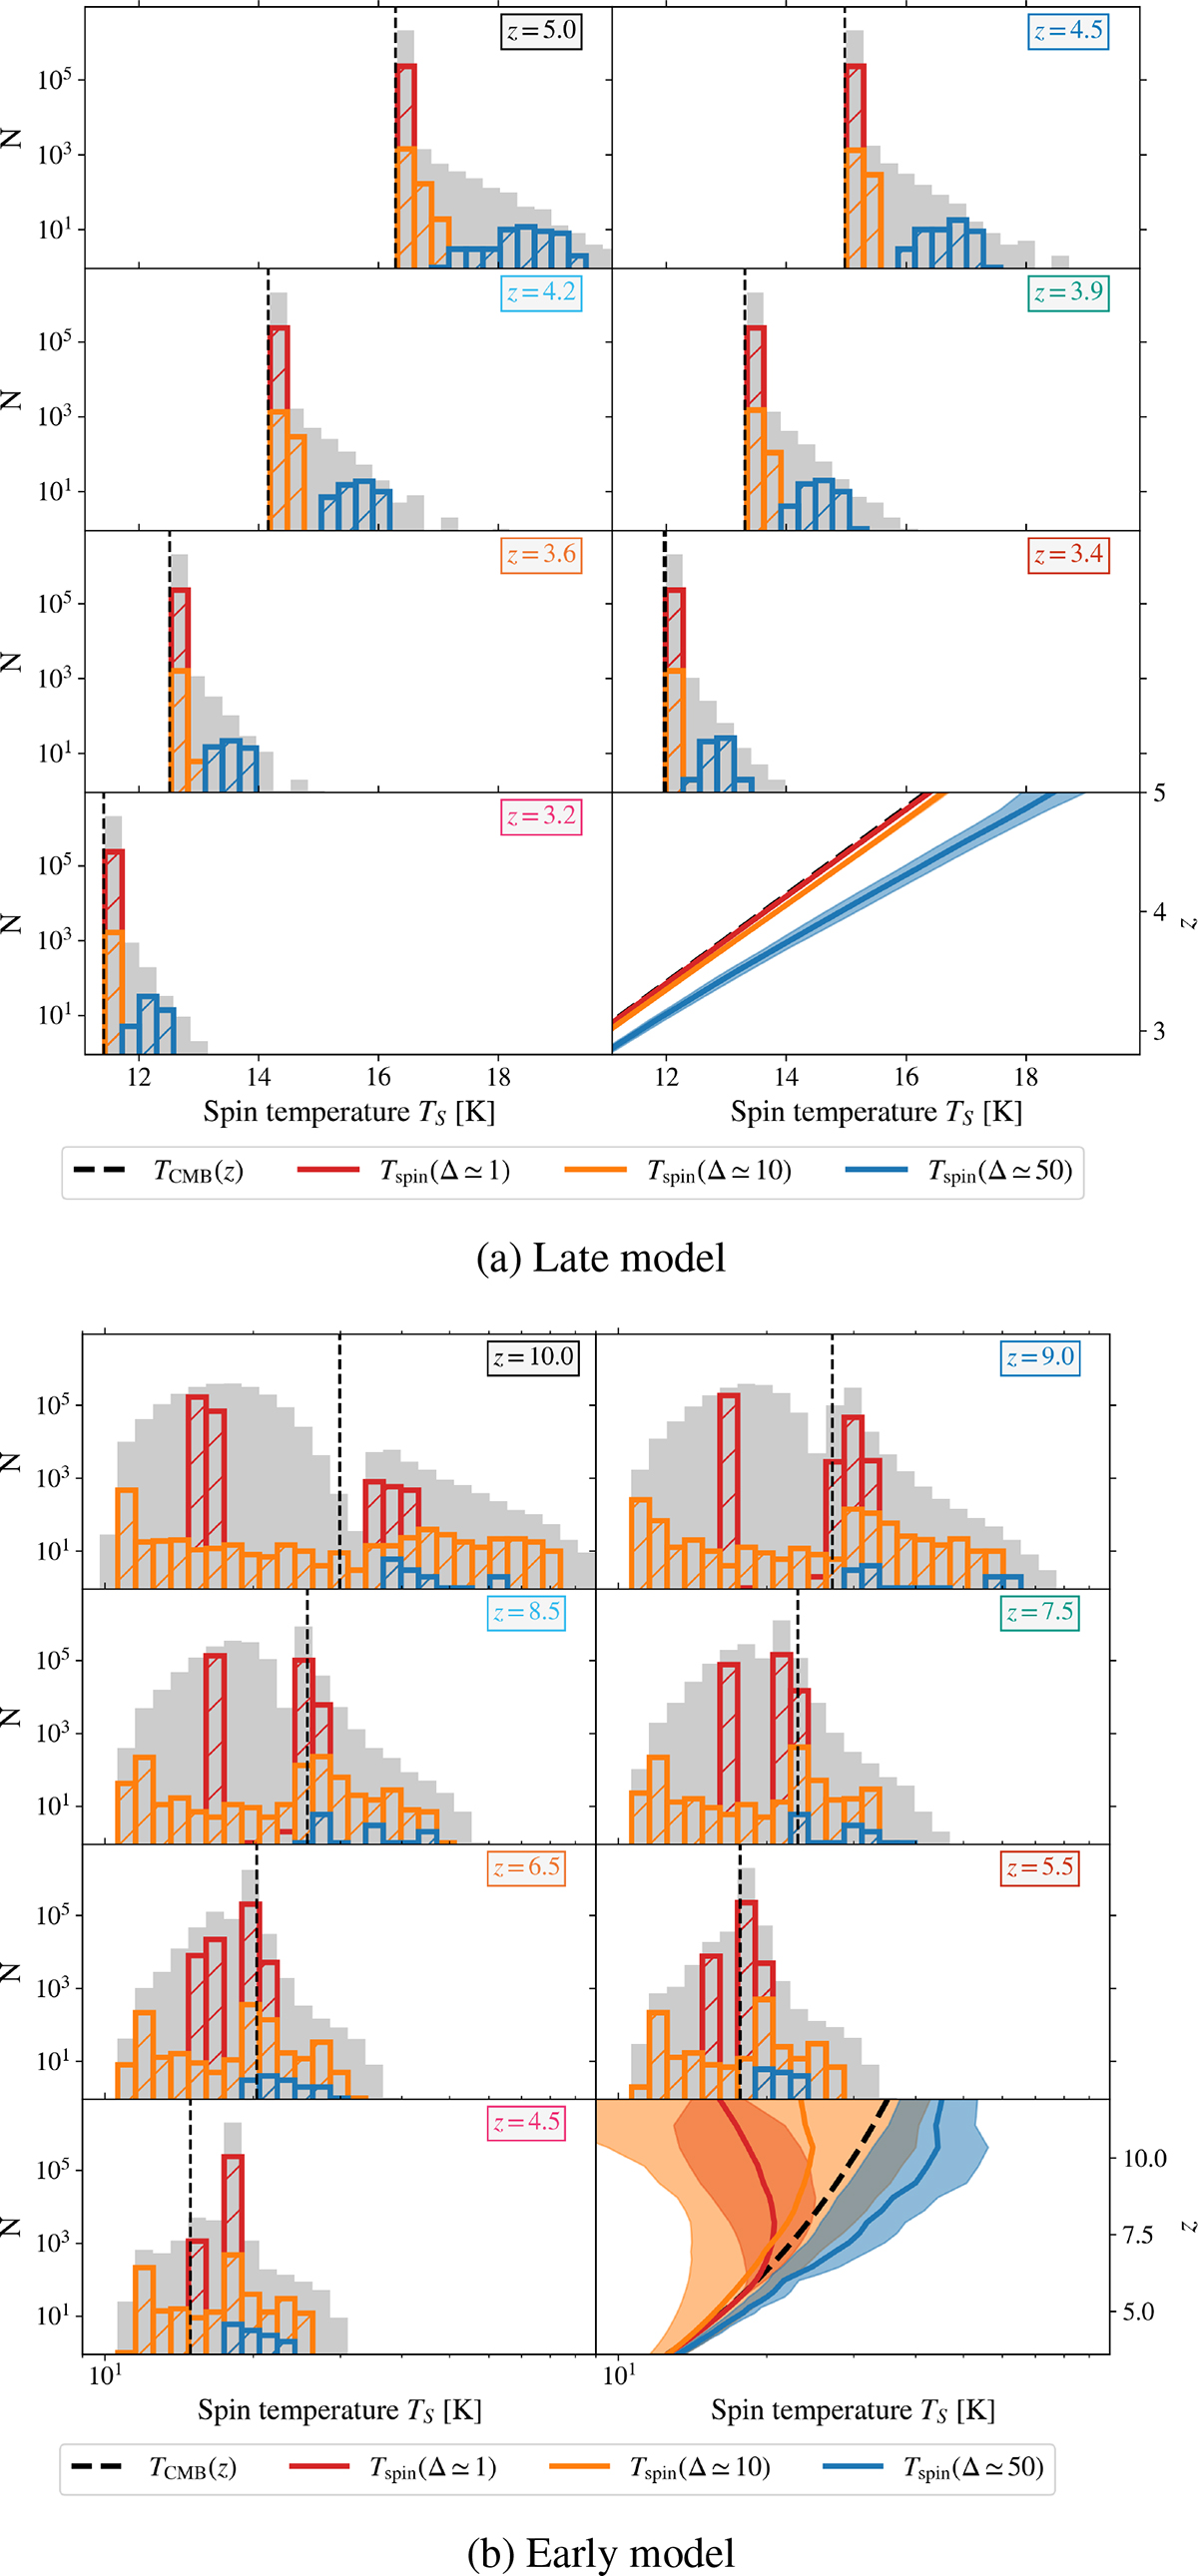
Fig. 2.
Download original image
Spin temperature distribution for both models at various redshifts. For each snapshot, the panels show the number of simulation voxels whose spin temperature falls within a given bin, N, as a function of the spin temperature. The spin temperature values corresponding to three overdensities, Δb = 1, 10, 50, are highlighted in red, orange and blue. The bottom-right panels display the evolution of the mean spin temperature with redshift together with its standard deviation.
Current usage metrics show cumulative count of Article Views (full-text article views including HTML views, PDF and ePub downloads, according to the available data) and Abstracts Views on Vision4Press platform.
Data correspond to usage on the plateform after 2015. The current usage metrics is available 48-96 hours after online publication and is updated daily on week days.
Initial download of the metrics may take a while.