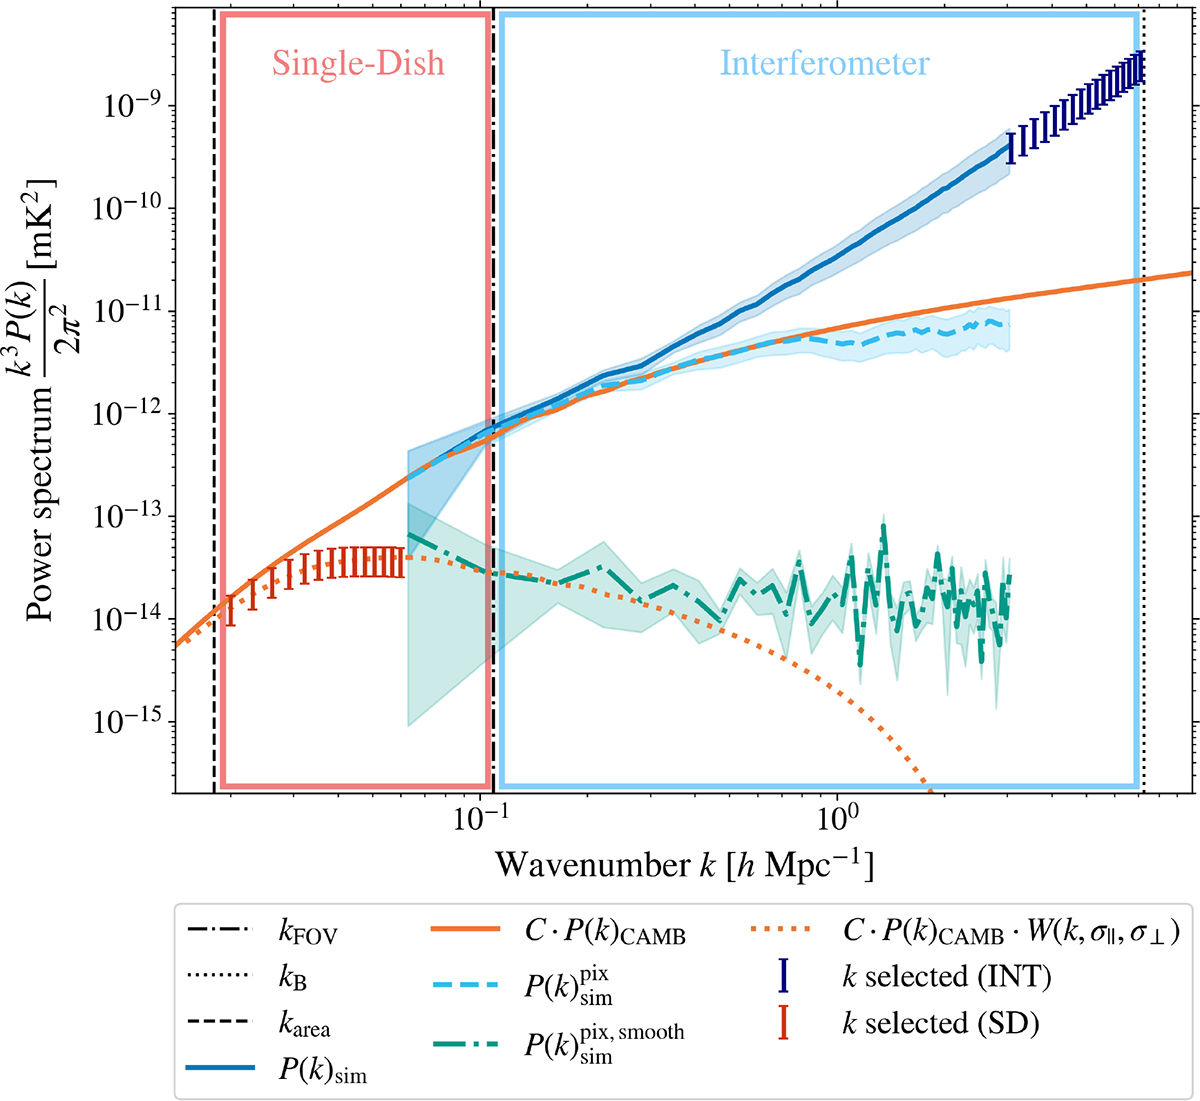
Fig. 5.
Download original image
Analysis of the power spectrum of the 3.46 cm line signal at redshift z = 4 for the late reionization scenario. Shown are the measured power spectrum from the simulations (solid blue line), the spectrum after accounting for the finite pixel size (dashed light-blue line), and the spectrum after Gaussian smoothing due to the angular resolution (dash-dotted green line). The rescaled matter power spectrum is displayed both in its raw form (solid orange line) and after smoothing (dotted orange line). Shaded regions indicate the 1σ scatter across the different simulation runs. The k-range accessible to SKA1-MID in single-dish (interferometic) mode is highlighted in red (blue). Vertical reference scales denote the wavenumbers corresponding to the telescope’s maximum angular resolution (kB, dotted black line), its field of view (kFOV, dash-dotted black line), and its pointing area (karea, dashed black line). The Gaussian smoothing applied corresponds to the angular resolution of SKA1-MID at z = 4.
Current usage metrics show cumulative count of Article Views (full-text article views including HTML views, PDF and ePub downloads, according to the available data) and Abstracts Views on Vision4Press platform.
Data correspond to usage on the plateform after 2015. The current usage metrics is available 48-96 hours after online publication and is updated daily on week days.
Initial download of the metrics may take a while.