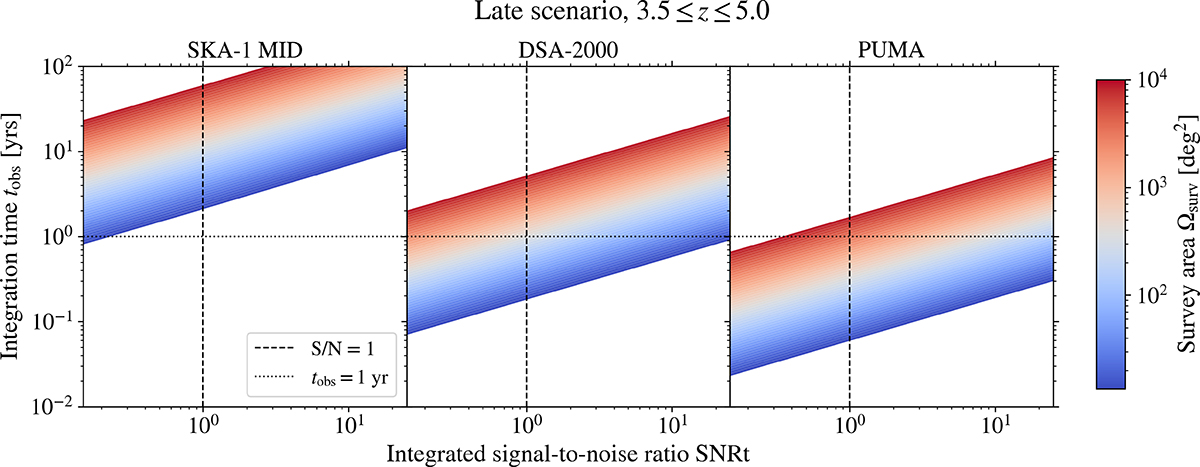
Fig. 6.
Download original image
Relation between the integration time (tobs) and the integrated signal-to-noise ratio (S/Nt) for the redshift range 3.5 ≤ z ≤ 5 for single-dish observations. Different colors represent different survey areas, Ωsurv, while the dotted black line shows a reference integration time of 1 year, and the dashed back lack line shows a reference S/Nt of 1. Each panel corresponds to a unique survey.
Current usage metrics show cumulative count of Article Views (full-text article views including HTML views, PDF and ePub downloads, according to the available data) and Abstracts Views on Vision4Press platform.
Data correspond to usage on the plateform after 2015. The current usage metrics is available 48-96 hours after online publication and is updated daily on week days.
Initial download of the metrics may take a while.