Fig. 1
Download original image
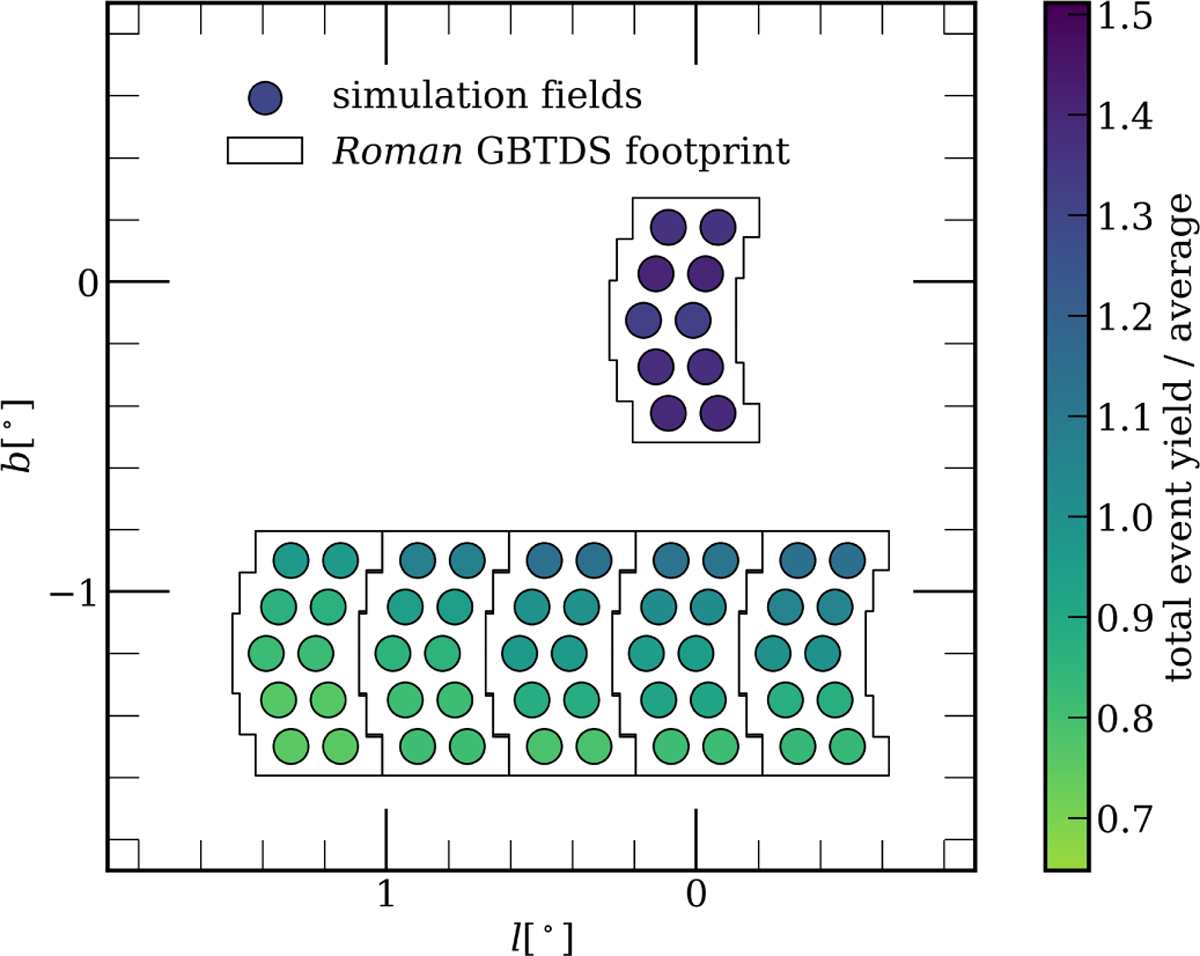
Layout of the simulation fields, over-plotted on the Roman GBTDS footprint as recommended by the Roman Observations Time Allocation Committee. The colours represent the total number of simulated microlensing events per simulation field over the average for all fields in the run with the PopSyCLE (Lam et al. 2020) default 350 km/s mean NS kick velocity (before applying the detectability cuts).
Current usage metrics show cumulative count of Article Views (full-text article views including HTML views, PDF and ePub downloads, according to the available data) and Abstracts Views on Vision4Press platform.
Data correspond to usage on the plateform after 2015. The current usage metrics is available 48-96 hours after online publication and is updated daily on week days.
Initial download of the metrics may take a while.