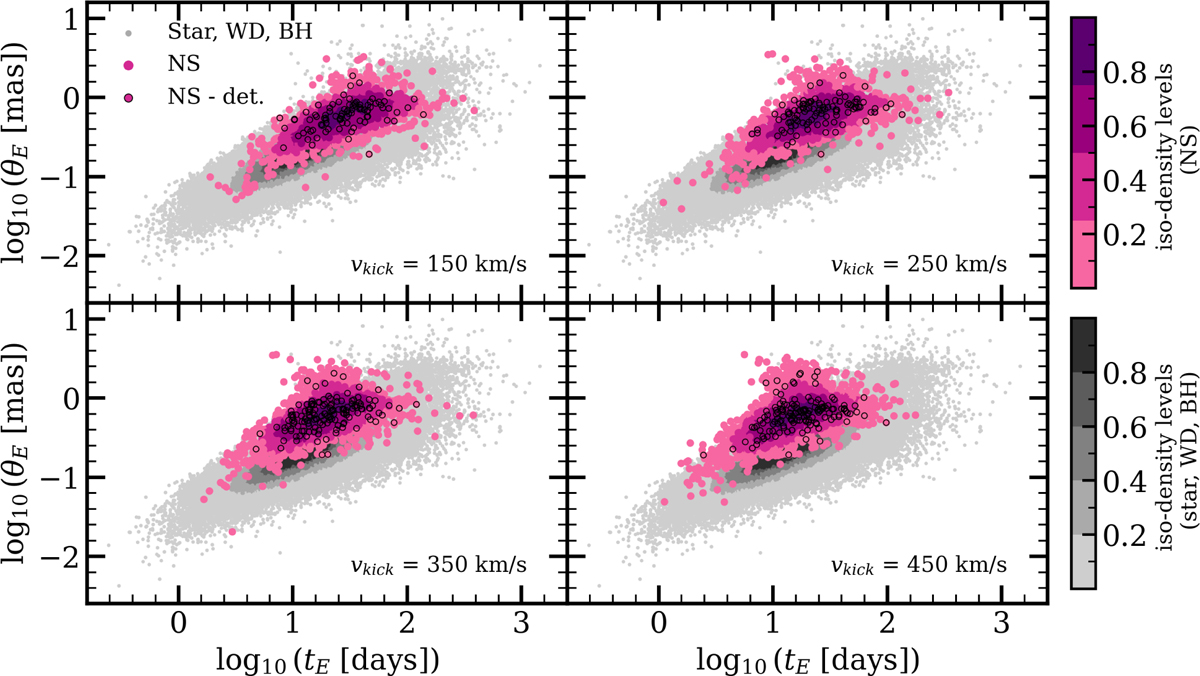
Fig. 3
Download original image
Distributions of NS (purple) and non-NS (grey) events in log10 tE–log10 θE space. All simulated events regardless of whether they passed the detectability cuts are plotted; shade denotes iso-density levels estimated with a Gaussian KDE. The black circles highlight the NS events that passed the detectability cuts. The NS distribution exhibits a characteristic spur feature that becomes stronger and more shifted leftwards with increasing vkick, yielding more detectable NSs that are outliers from the main distribution.
Current usage metrics show cumulative count of Article Views (full-text article views including HTML views, PDF and ePub downloads, according to the available data) and Abstracts Views on Vision4Press platform.
Data correspond to usage on the plateform after 2015. The current usage metrics is available 48-96 hours after online publication and is updated daily on week days.
Initial download of the metrics may take a while.