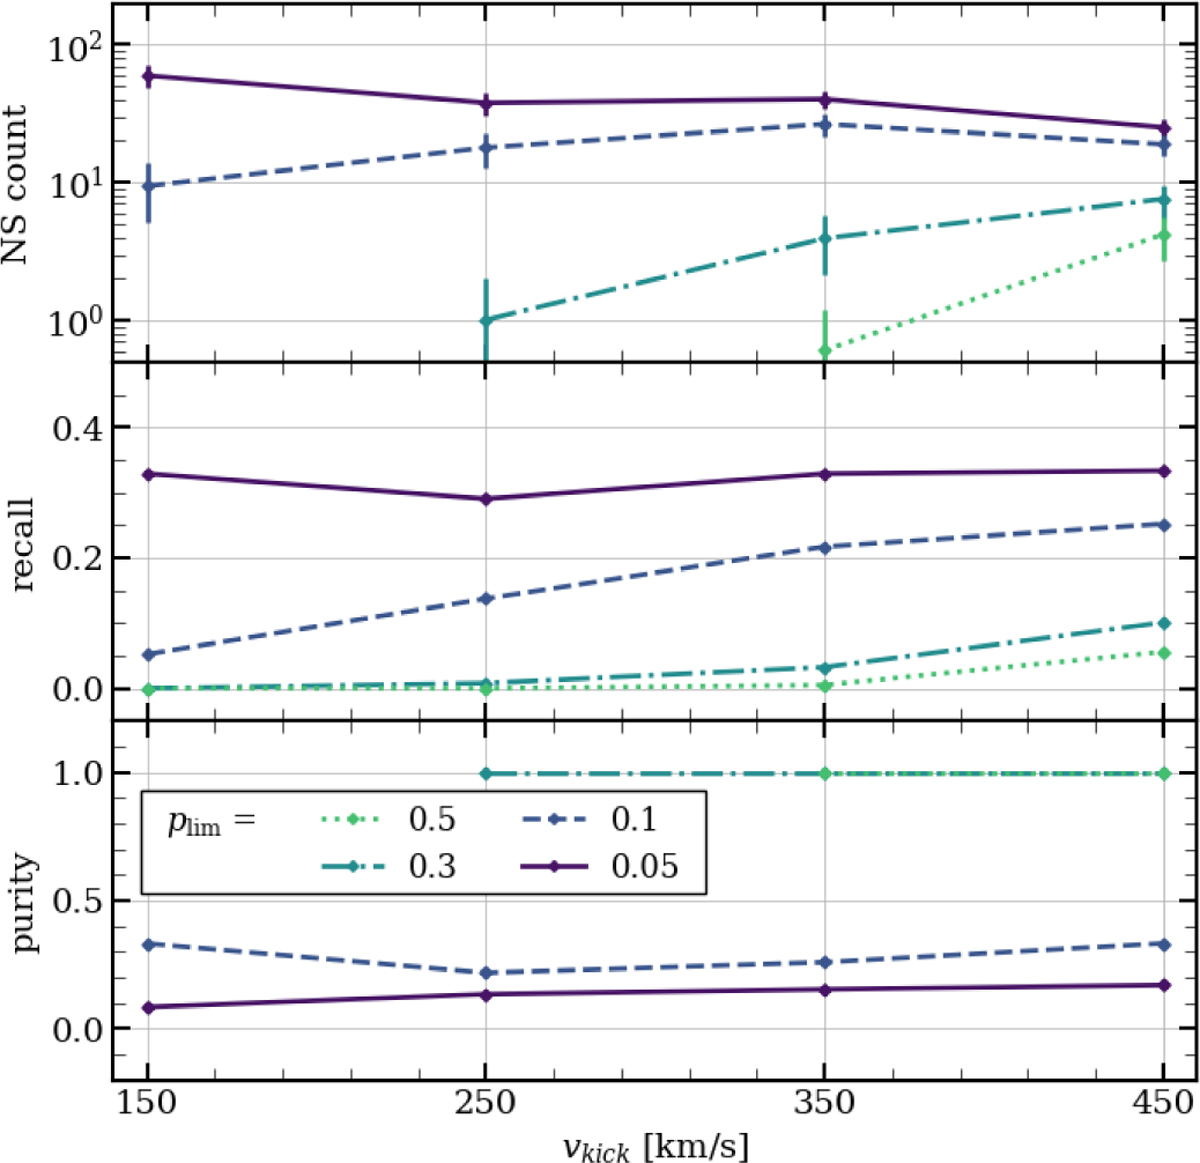
Fig. 8
Download original image
Top: count of retained NS events within an event sample constructed using a given plim, rescaled to yields from the full GBTDS footprint. The error bars representing Poisson noise are the same as in Fig. 2. Centre: recall of NS events, calculated as a ratio of selected NS events to all detectable NS events. Bottom: purity of the sample, calculated as a ratio of selected NS events to all events selected for the sample. For higher plim, values for vkick ∈ (150, 250) km/s are missing as samples cannot be constructed (i.e. the resulting sample size is 0).
Current usage metrics show cumulative count of Article Views (full-text article views including HTML views, PDF and ePub downloads, according to the available data) and Abstracts Views on Vision4Press platform.
Data correspond to usage on the plateform after 2015. The current usage metrics is available 48-96 hours after online publication and is updated daily on week days.
Initial download of the metrics may take a while.