Open Access
Fig. 4.
Download original image
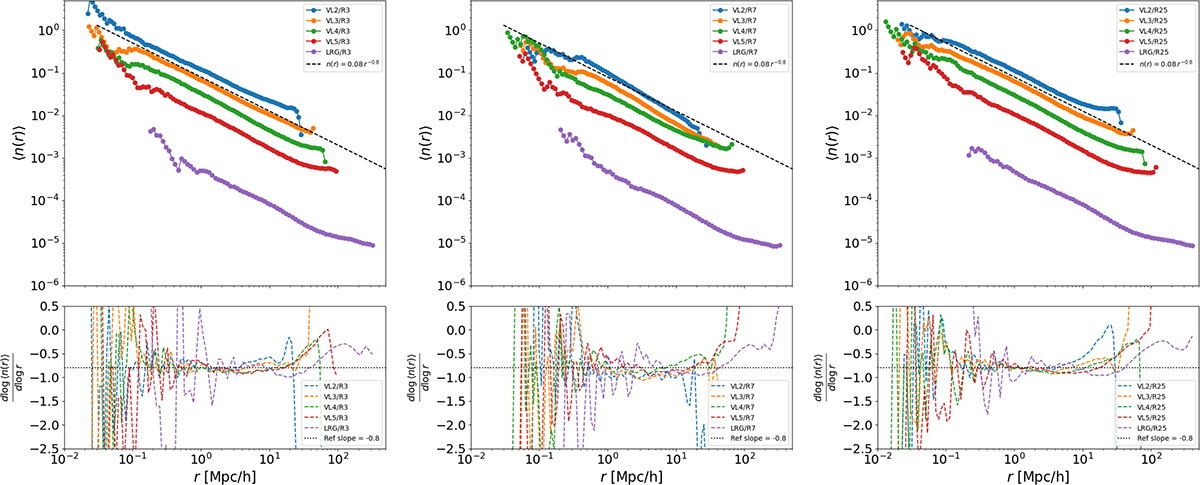
Conditional average density ⟨n(r)⟩ (Eq. (3)) measured in the four volume-limited subsamples – VL2, VL3, VL4, and VL5 – extracted from the BGS, and from the LRGS. Each panel corresponds to one of the three angular regions: R3, R7, and R25. In the bottom panels it the logarithmic derivative is shown.
Current usage metrics show cumulative count of Article Views (full-text article views including HTML views, PDF and ePub downloads, according to the available data) and Abstracts Views on Vision4Press platform.
Data correspond to usage on the plateform after 2015. The current usage metrics is available 48-96 hours after online publication and is updated daily on week days.
Initial download of the metrics may take a while.