Open Access
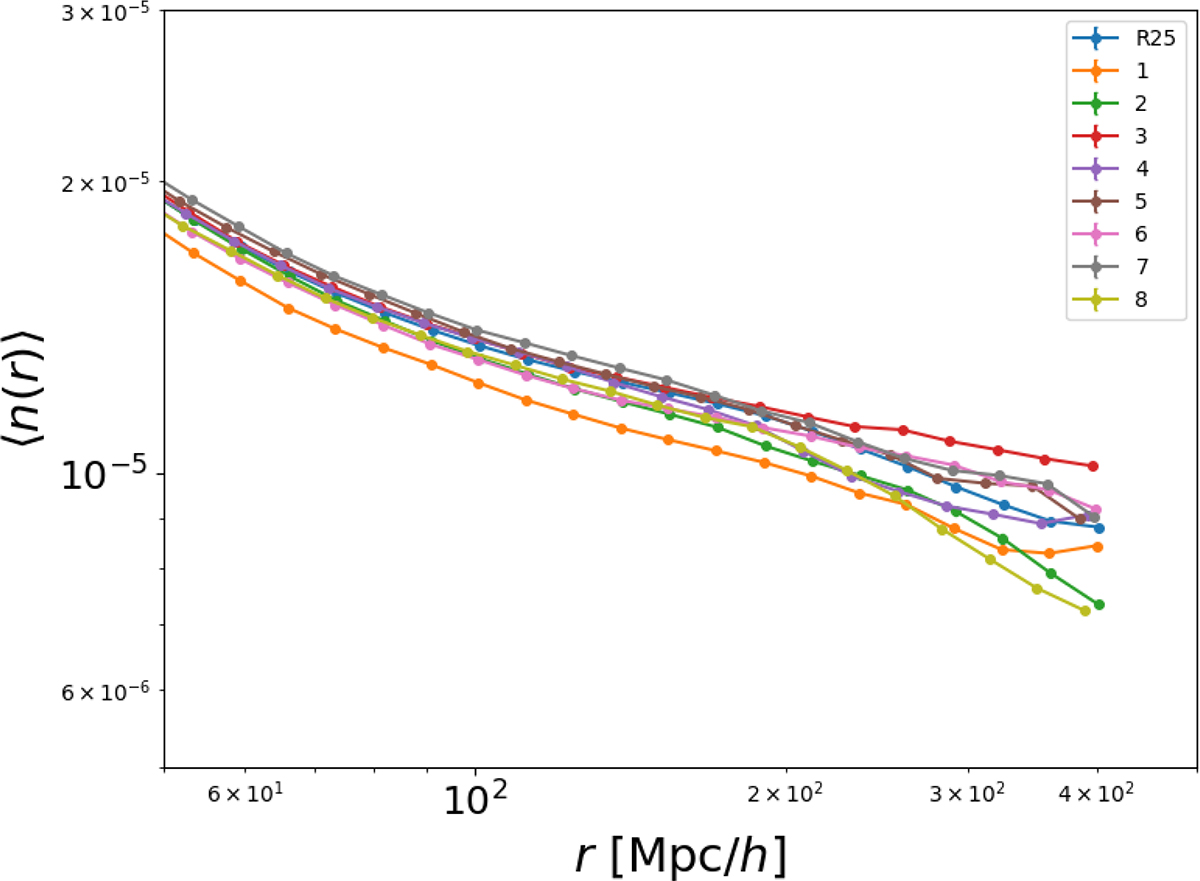
Fig. 5.
Download original image
Average conditional density for the LRGS in eight non-overlapping subregions of R25. One may note that non-negligible fluctuations, of order ∼20%, characterize the variation of the average conditional density among these subregions.
Current usage metrics show cumulative count of Article Views (full-text article views including HTML views, PDF and ePub downloads, according to the available data) and Abstracts Views on Vision4Press platform.
Data correspond to usage on the plateform after 2015. The current usage metrics is available 48-96 hours after online publication and is updated daily on week days.
Initial download of the metrics may take a while.