Open Access
Fig. 6.
Download original image
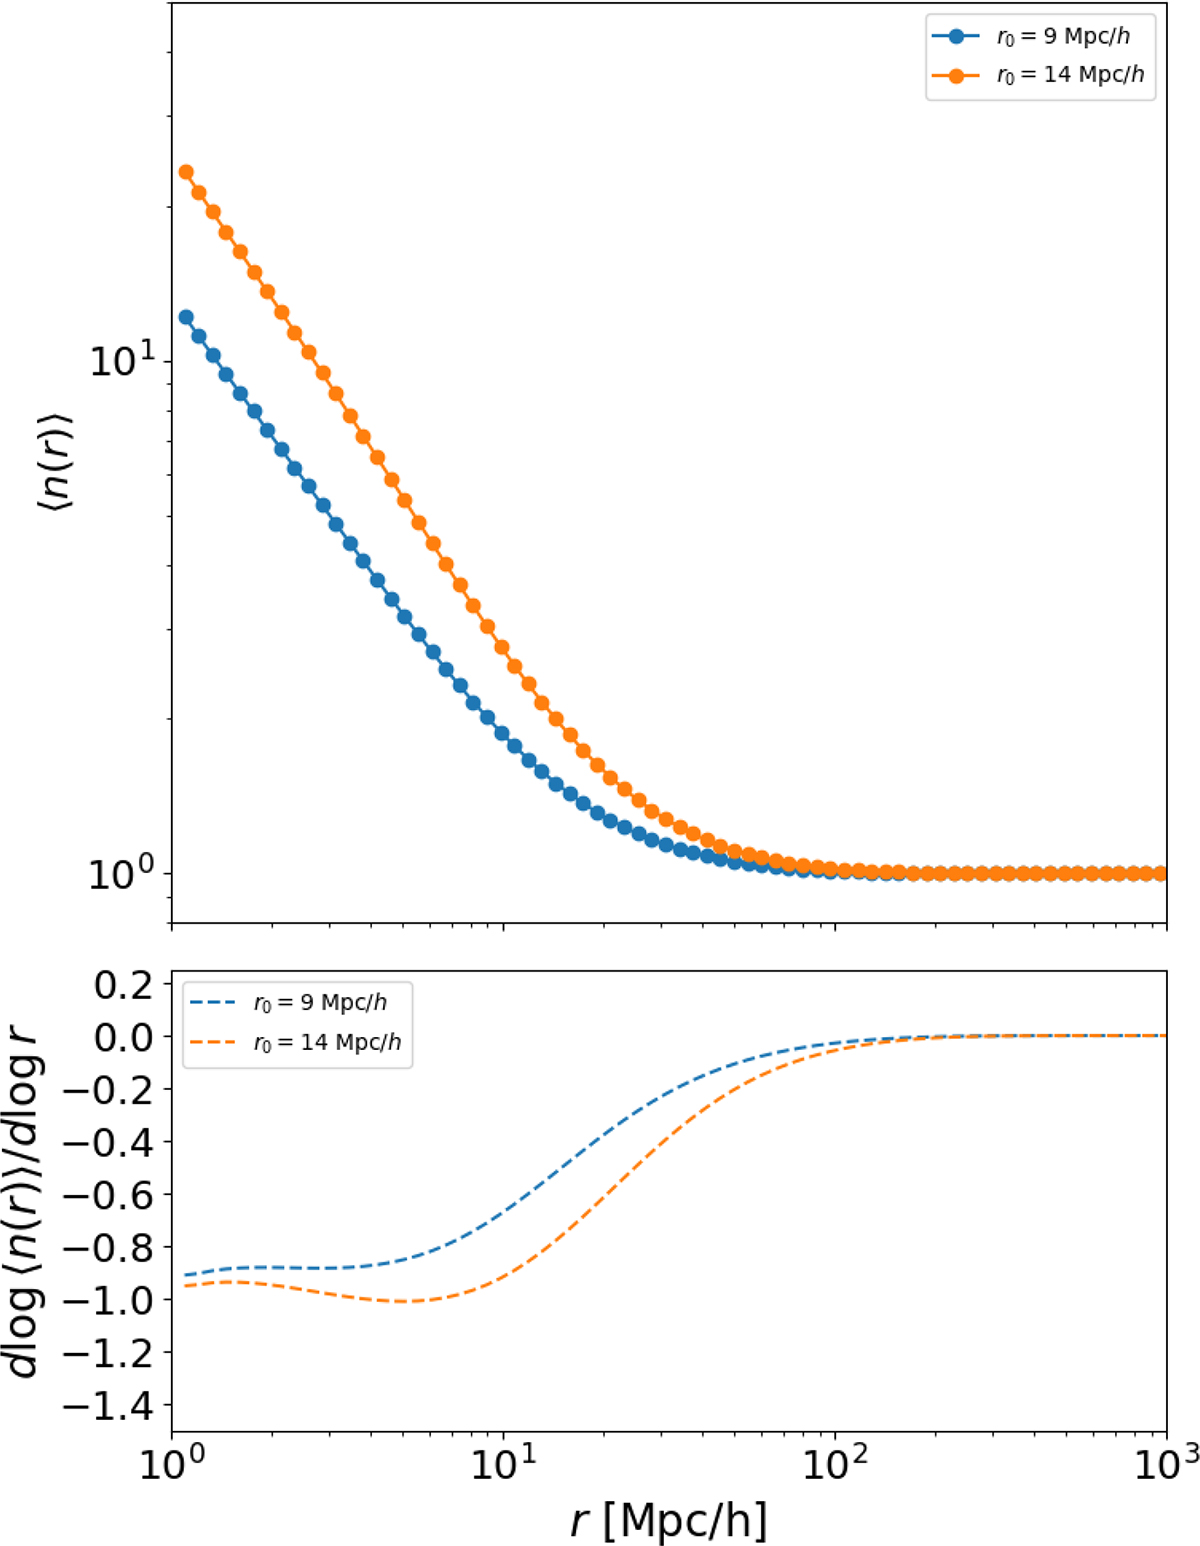
Conditional density in a CDM model. Upper panel: Behavior of the average conditional density (in units of the mean density n0) in a CDM model for different amplitudes, as characterized by the length scale r0 defined by ![]() . Bottom panel: logarithmic slope.
. Bottom panel: logarithmic slope.
Current usage metrics show cumulative count of Article Views (full-text article views including HTML views, PDF and ePub downloads, according to the available data) and Abstracts Views on Vision4Press platform.
Data correspond to usage on the plateform after 2015. The current usage metrics is available 48-96 hours after online publication and is updated daily on week days.
Initial download of the metrics may take a while.